
During a recent NQ session, price spent the morning chopping between the overnight high and the lows, and I kept telling the room the same thing. Before I could engage, I needed price at one of two spots: a pullback into the prior day high near 28K, or a break of the overnight high followed by a retest. Everything in between was no man's land, and chat kept pointing out how much movement was happening in it.
I said it plainly on the stream: "before I can engage, I need this spot or this spot." Then I sat there and let the middle of the range go by.
That habit is the most useful thing the Wyckoff method ever gave me. It's also the part people skip. They memorize a schematic full of acronyms, then trade the middle of the range anyway, because nobody told them that location decides whether any Wyckoff pattern means something. This article covers what the method is, where the common misreadings come from, and how I apply it on NQ intraday.
What the Wyckoff Method Is
The Wyckoff method is a way of reading supply and demand through price and volume to judge whether large players are accumulating a position or distributing one. Richard Wyckoff developed it in the early 1900s as a stock trader, tape reader and publisher, and it has been taught ever since because the thing it measures (who is in control, buyers or sellers) never goes out of date.
You don't need a mystical framework to use it. You need to answer three questions on any chart: where is price relative to the range it has been building, how did it behave the last time it touched the edge of that range, and how much effort did it take to get there compared with the result.
The method breaks a market cycle into four phases. Accumulation is where big buyers absorb supply at low prices. Markup is the trend that follows. Distribution is where those same players sell into demand near the highs. Markdown is the trend down after that. Almost every other Wyckoff term is a label for something that happens inside one of those four phases.
Three Misreadings That Cost Traders Months
The schematic is a diagram, and real charts are messy. The textbook accumulation picture is clean on purpose. On a live NQ chart you get a version with extra tests, a spring that undercuts a little too far, and a range that tilts. If you wait for the chart to match the picture, you will wait forever. You are reading behavior, and the acronyms only help you name what the behavior is doing.
It belongs to daily stock charts. Wyckoff built his work reading the tape, which is about as granular as it gets. Supply and demand show up on a 5-minute NQ chart the same way they show up on a weekly chart, because every liquid market has buyers and sellers fighting over the same prices. A shorter timeframe changes how long things take, while the underlying logic holds steady.
A phase label is a trade. Calling something accumulation tells you what the larger picture might be. It tells you nothing about where to enter, where you are wrong, or whether you should be in the trade at all. I see this constantly: someone labels a range correctly and still loses money because they bought in the middle of it.
A Thinktank member, Robert Onsomu, described the before and after of fixing this better than I could:
"Prior to joining, I was a predictor and anticipator. I didn't have proper rules of engagement. Since joining, I have learned to be patient and actually learned to trade." (Robert Onsomu)
Rules of engagement are what turn a Wyckoff read into something you can execute.
The Three Laws Underneath Everything
Strip out the vocabulary and the method rests on three ideas. Learn these before you learn a single event name.
Supply and demand: Price rises when demand overwhelms supply and falls when supply overwhelms demand. When the two balance, price goes sideways, and that sideways stretch is the range you are trying to read.
Cause and effect: The size of a move depends on the size of the base that came before it. A long, tight range stores more energy than a quick pause, which is why I give more weight to levels that held for days than to ones that formed this morning.
Effort versus result: Heavy volume with little price progress says one side is absorbing the other. Light volume with big progress says the move met no resistance. When effort and result disagree, pay attention, because someone is doing something behind the scenes.
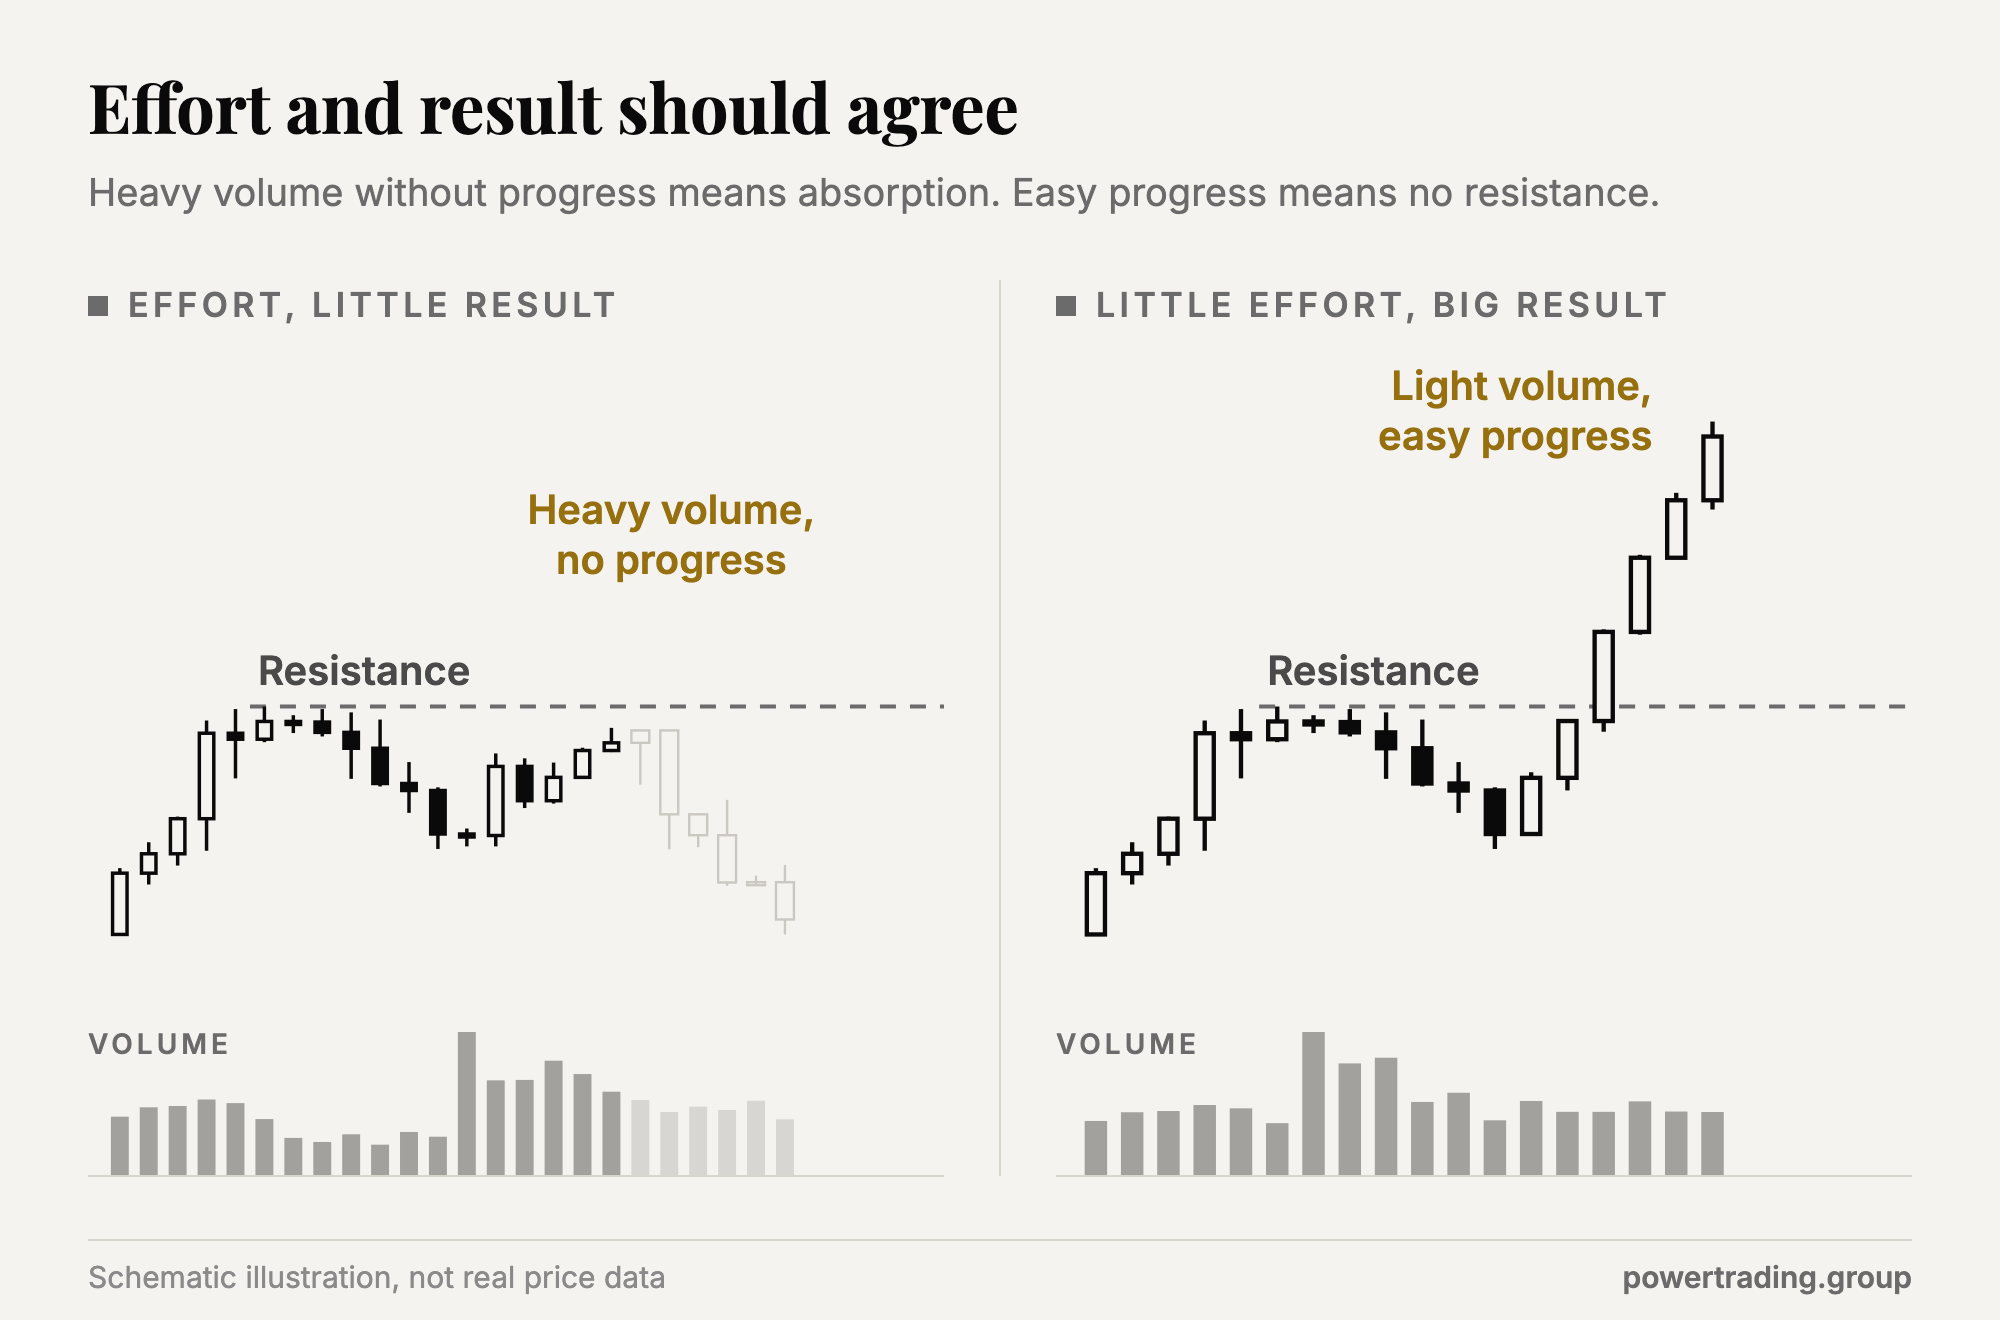
Effort versus result is the law I use most intraday. A push into the overnight high on a burst of volume that stalls out tells me more than any pattern name.
The Events Worth Knowing
You can learn the full list of events in a weekend. A handful do most of the work on a futures chart.
In accumulation, a selling climax is the panic flush where supply gets exhausted. The automatic rally that follows sets the top of the range, and a secondary test comes back to retest the low on lighter volume. The spring is a quick break below support that fails and snaps back, shaking out weak longs before the real move. A sign of strength breaks above resistance, and the last point of support is the pullback that holds on the way up.
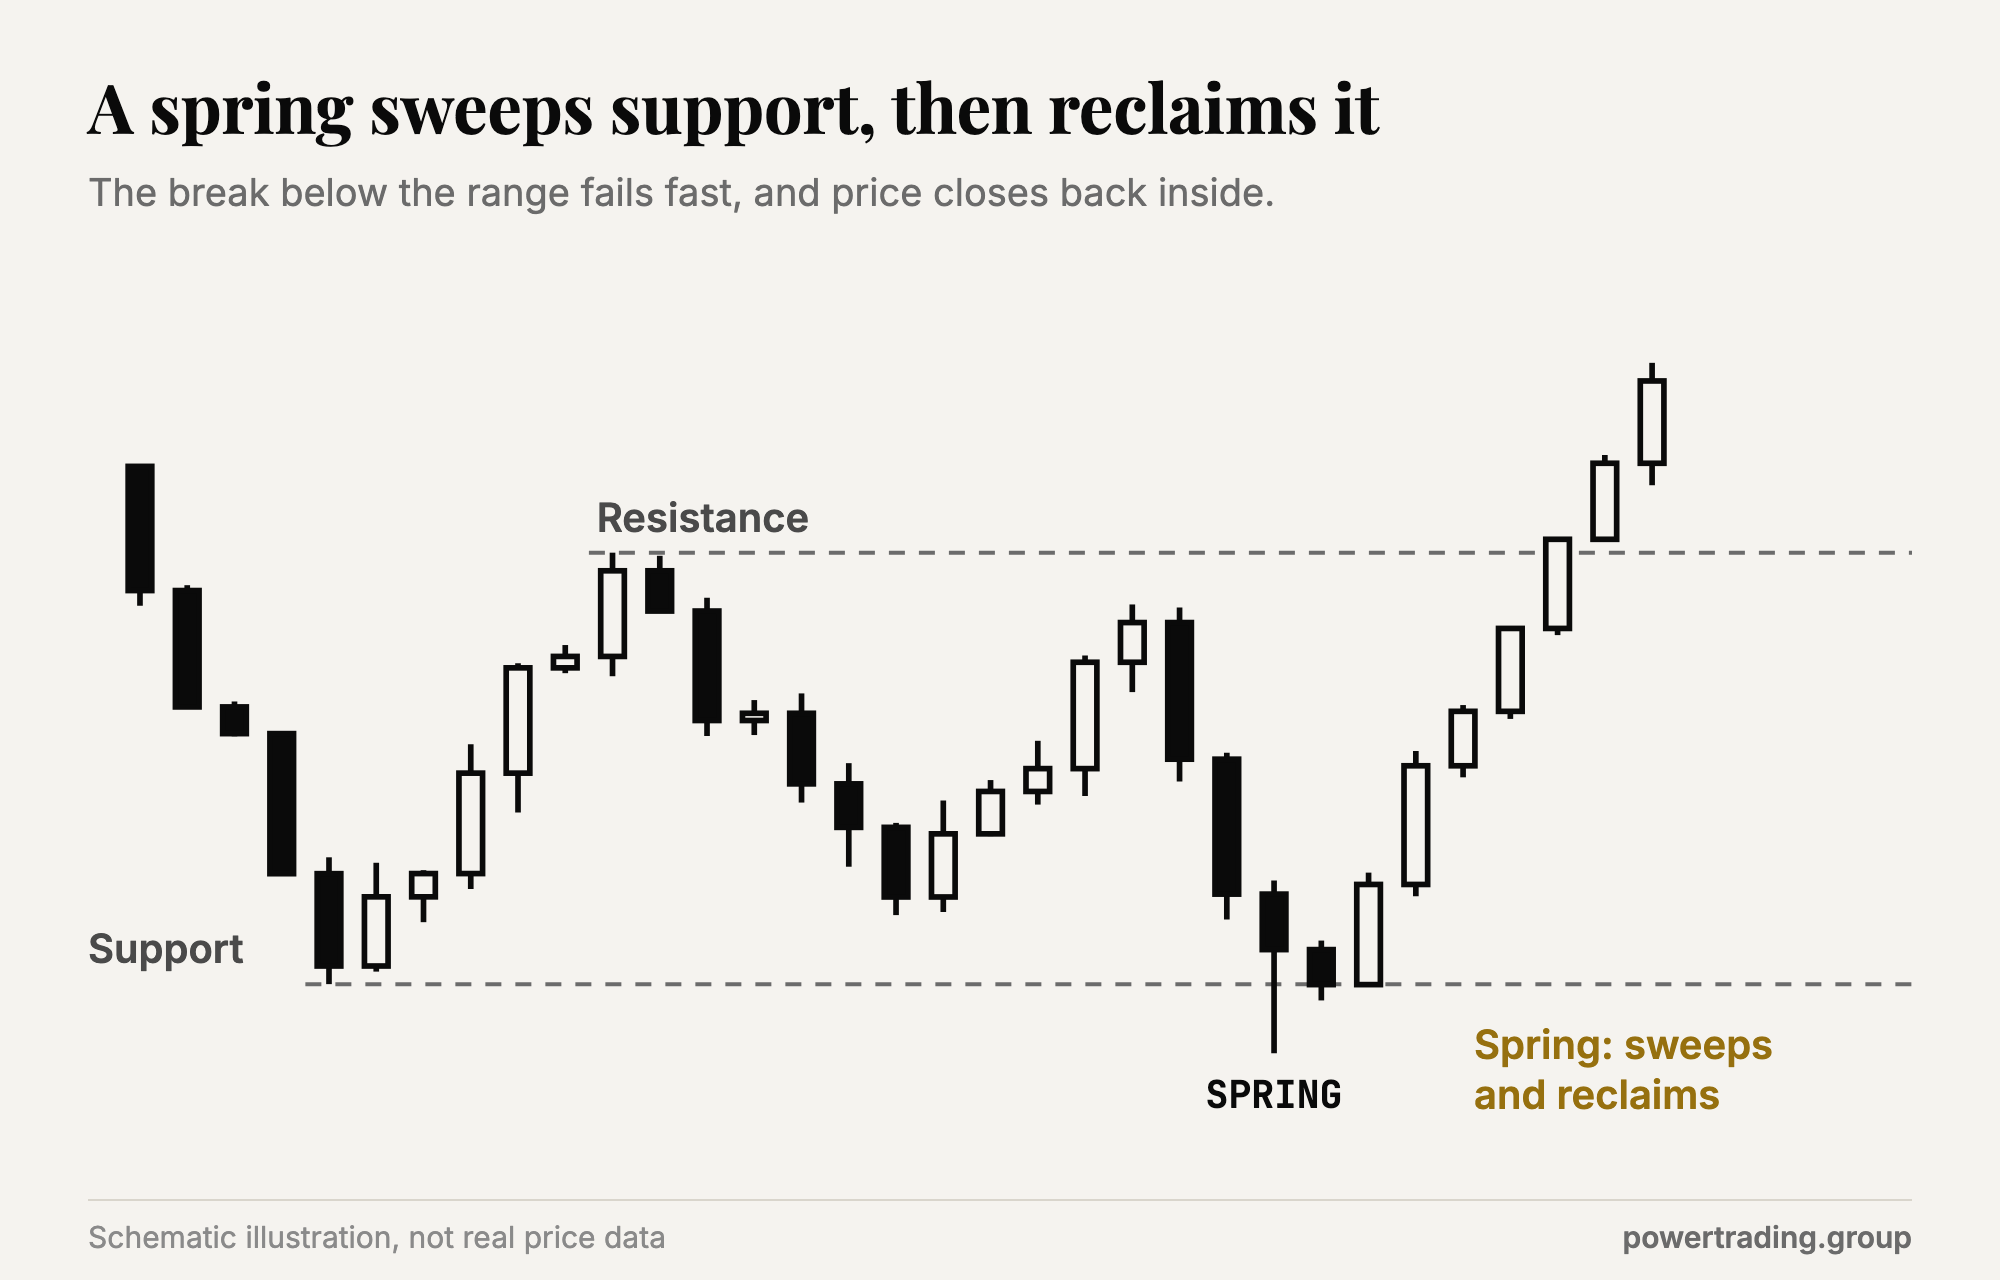
Distribution mirrors that sequence. A buying climax tops the move, an upthrust pokes above resistance and fails, and a sign of weakness breaks the range low. If you want a closer look at the spring specifically, I wrote a full breakdown in how to identify and trade the spring setup, and the broader theory has its own write-up in the Wyckoff method and how the market is moving.
I took that same spring idea and built it into AutoPilot Trader as a rules-based strategy on a faster chart. Spring released on September 28, 2026 on NQ and MNQ, and it behaves independently of the Two Hour Trader strategy running alongside it. Every published figure for it sits on the APT performance page, labeled as simulated. You can see how the system runs in AutoPilot Trader.
Why Location Decides Everything
Back to that morning near 28K. Price had no trouble moving. It moved plenty, up and down inside the range, and each leg looked tradable if you stared at it long enough. What it lacked was a reason. A move in the middle of a range gives you a bad stop location and a poor reward-to-risk, and you can't tell from the tape whether buyers or sellers own it.
The two spots I named were edges. A pullback into the prior day high is a test of a level the market already cared about. A break of the overnight high followed by a retest asks the same question from the other side: does former resistance now hold as support? At either place I can read effort versus result, define where I'm wrong, and size accordingly. In the middle I can do none of those things.
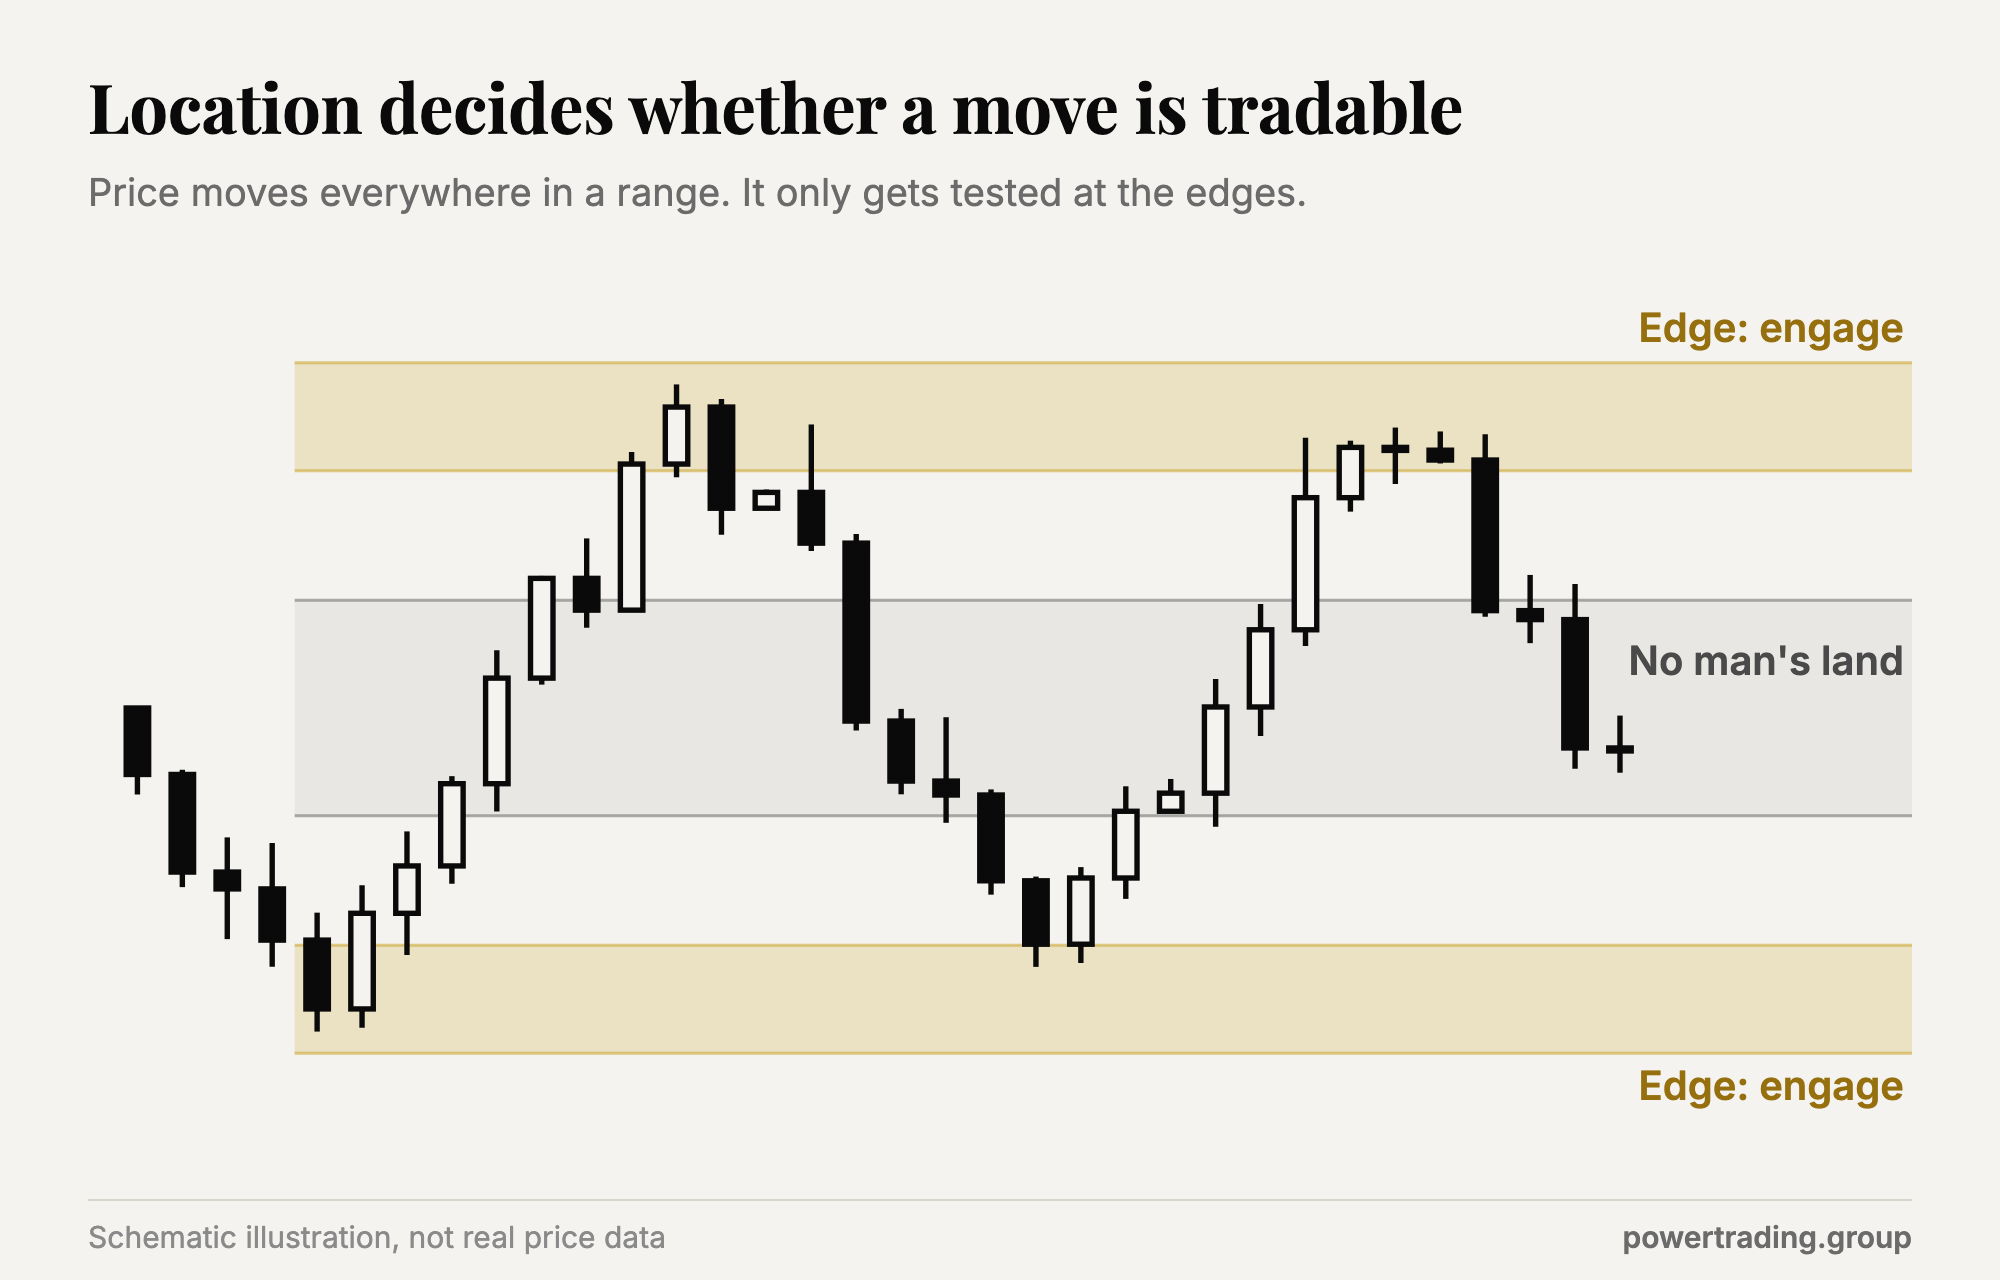
This is the real lesson of the Wyckoff method for a day trader. The market spends most of its time in ranges, and the money is made at the edges where supply and demand get tested. If you want the same idea from the structure side, understanding market structure in trading covers how those ranges form.
How I Apply It on NQ Intraday
Here is the sequence I run every morning. It takes a few minutes before the open and gives me a short list of places where I'm willing to act.
Mark the range. I draw the prior day high and low, the overnight high and low, and any level that has held for several sessions. In the Trader's Thinktank this is built into the 8:45 AM ET game plan, and the PTG Levels of Interest indicator plots the structural areas I mark so everyone works from the same map.
Decide which edges I'll trade. I pick the one or two spots where I will engage and write them down. Everything between them is out of bounds.
Wait for the test. I let price come to the edge. I don't chase it there.
Read effort versus result at the edge. Does price reject quickly on rising volume, or push through with ease? Absorption and easy movement look different, and the difference tells me whether to fade or follow.
Define the invalidation before entry. If price accepts beyond the level, the read is wrong and I'm out. A Wyckoff read earns its keep because it comes with a clear place to be wrong.
If you want the simplest version of this to start with, The Two Hour Trader teaches one high-probability setup in 43 minutes, and it pairs well with a location-first mindset.
Does the Wyckoff Method Still Work?
Yes, because supply and demand still drive every price on every chart. What the method doesn't give you on its own is a set of entry rules, a stop placement or a position size. It tells you who is likely in control. You supply the plan.
That is why traders split on it. Some use it as a lens and combine it with defined levels and risk rules, and it sharpens their trading. Others try to use it as a signal generator, memorize forty events, and never place a trade they can defend. The method works as a map. Treat it like a trigger and it will let you down.
As for whether Richard Wyckoff was a successful trader, he built a long career as a stock operator and became one of the most influential educators of his era, which is why the method still carries his name more than a century later.
One of our members, EH, described what separates a real approach from a sales pitch:
"Unlike other gurus who may focus on trying to sell you indicators, Kyle has a singular focus on helping his members execute, with an emphasis on simplicity and discipline." (EH)
Simplicity is what I'd tell anyone starting with Wyckoff. Pick the three laws, two or three events, and one instrument.
Three Exercises to Make It Stick
Reading about the method gets you to about 20 percent. These exercises do the rest.
The edge audit: Pull up yesterday's NQ chart and mark the range. Circle every trade you would have taken in the middle of it. Count them.
The effort log: For the next five sessions, write one sentence each time price tests a level: what volume did, what price did, and who won. After a week you will start seeing absorption without trying.
The two-spot rule: Before the open, write down the only two prices where you will trade. If price never gets there, the day's trading is done, and that counts as a win. If you want to stress-test that discipline with other people watching the same map, the Trader's Thinktank walks through it live every morning.
The five pillars of trading edge is a good companion if you want to see where location fits in the bigger picture, and if you're wondering how long it takes to get comfortable, how long it takes to become consistently profitable gives an honest timeline.
Tomorrow morning, before the open, mark your two spots and write them where you can see them. When price chops through the middle and chat starts calling out every wiggle, you'll already know what you're waiting for, and you'll be able to let it go by.