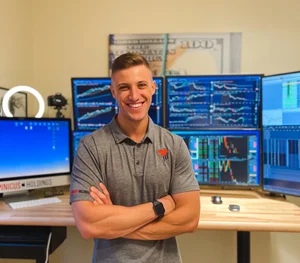
The plan that morning was specific, and it came straight from the Wyckoff methodology I've traded for years. Buy a spring low at the overnight low on NQ, or take structural longs near the 28k area. Neither happened. Price bounced off the previous day's low instead, and for a few seconds the bounce looked tempting, because the previous day's low, a Fib buy zone and VWAP all lined up in the same spot. Plenty of other participants had those same references on their screens.
I said it out loud on the stream:
"This wasn't part of my plans this morning. I would give this probably a B or B+ quality as far as long opportunities here."
I stayed in cash and called it a possible scalp for anyone who wanted it. Then the two-to-five minute window after the open closed without a clean entry, and I finished the morning flat.
Passing on that bounce took years to learn. For a long stretch I used Wyckoff the way a lot of people do, as a labeling exercise. This article covers how I moved from that to using it as a filter that tells me when to do nothing.
The phase where I labeled everything
My early Wyckoff charts looked impressive. Preliminary support, selling climax, automatic rally, secondary test, each one tagged with a neat abbreviation, and a spring marked on every dip below a range low. Hindsight makes any chart look like a textbook diagram, and I mistook that for skill.
The problem showed up in real time. A label can be defended on almost any pullback, so I kept finding reasons to be in a trade. If a bounce sat near a prior low, I called it a spring. If it stalled at VWAP, I called it a test. The method was supplying the vocabulary while I supplied the entries, which meant it wasn't filtering anything.
Losing days weren't the only cost. Mornings where nothing qualified felt like wasted time, so I manufactured setups to fill them. If you've ever forced a trade because the chart had to be doing something, you know where that road ends.
What the Wyckoff methodology covers
Richard Wyckoff built his approach in the early 1900s by studying how large operators accumulated and distributed stock. The core of the Wyckoff methodology fits into three laws and one cycle.
The three laws:
Supply and demand: price rises when demand exceeds supply and falls when supply exceeds demand. Everything else in the method is a way of measuring which side has control.
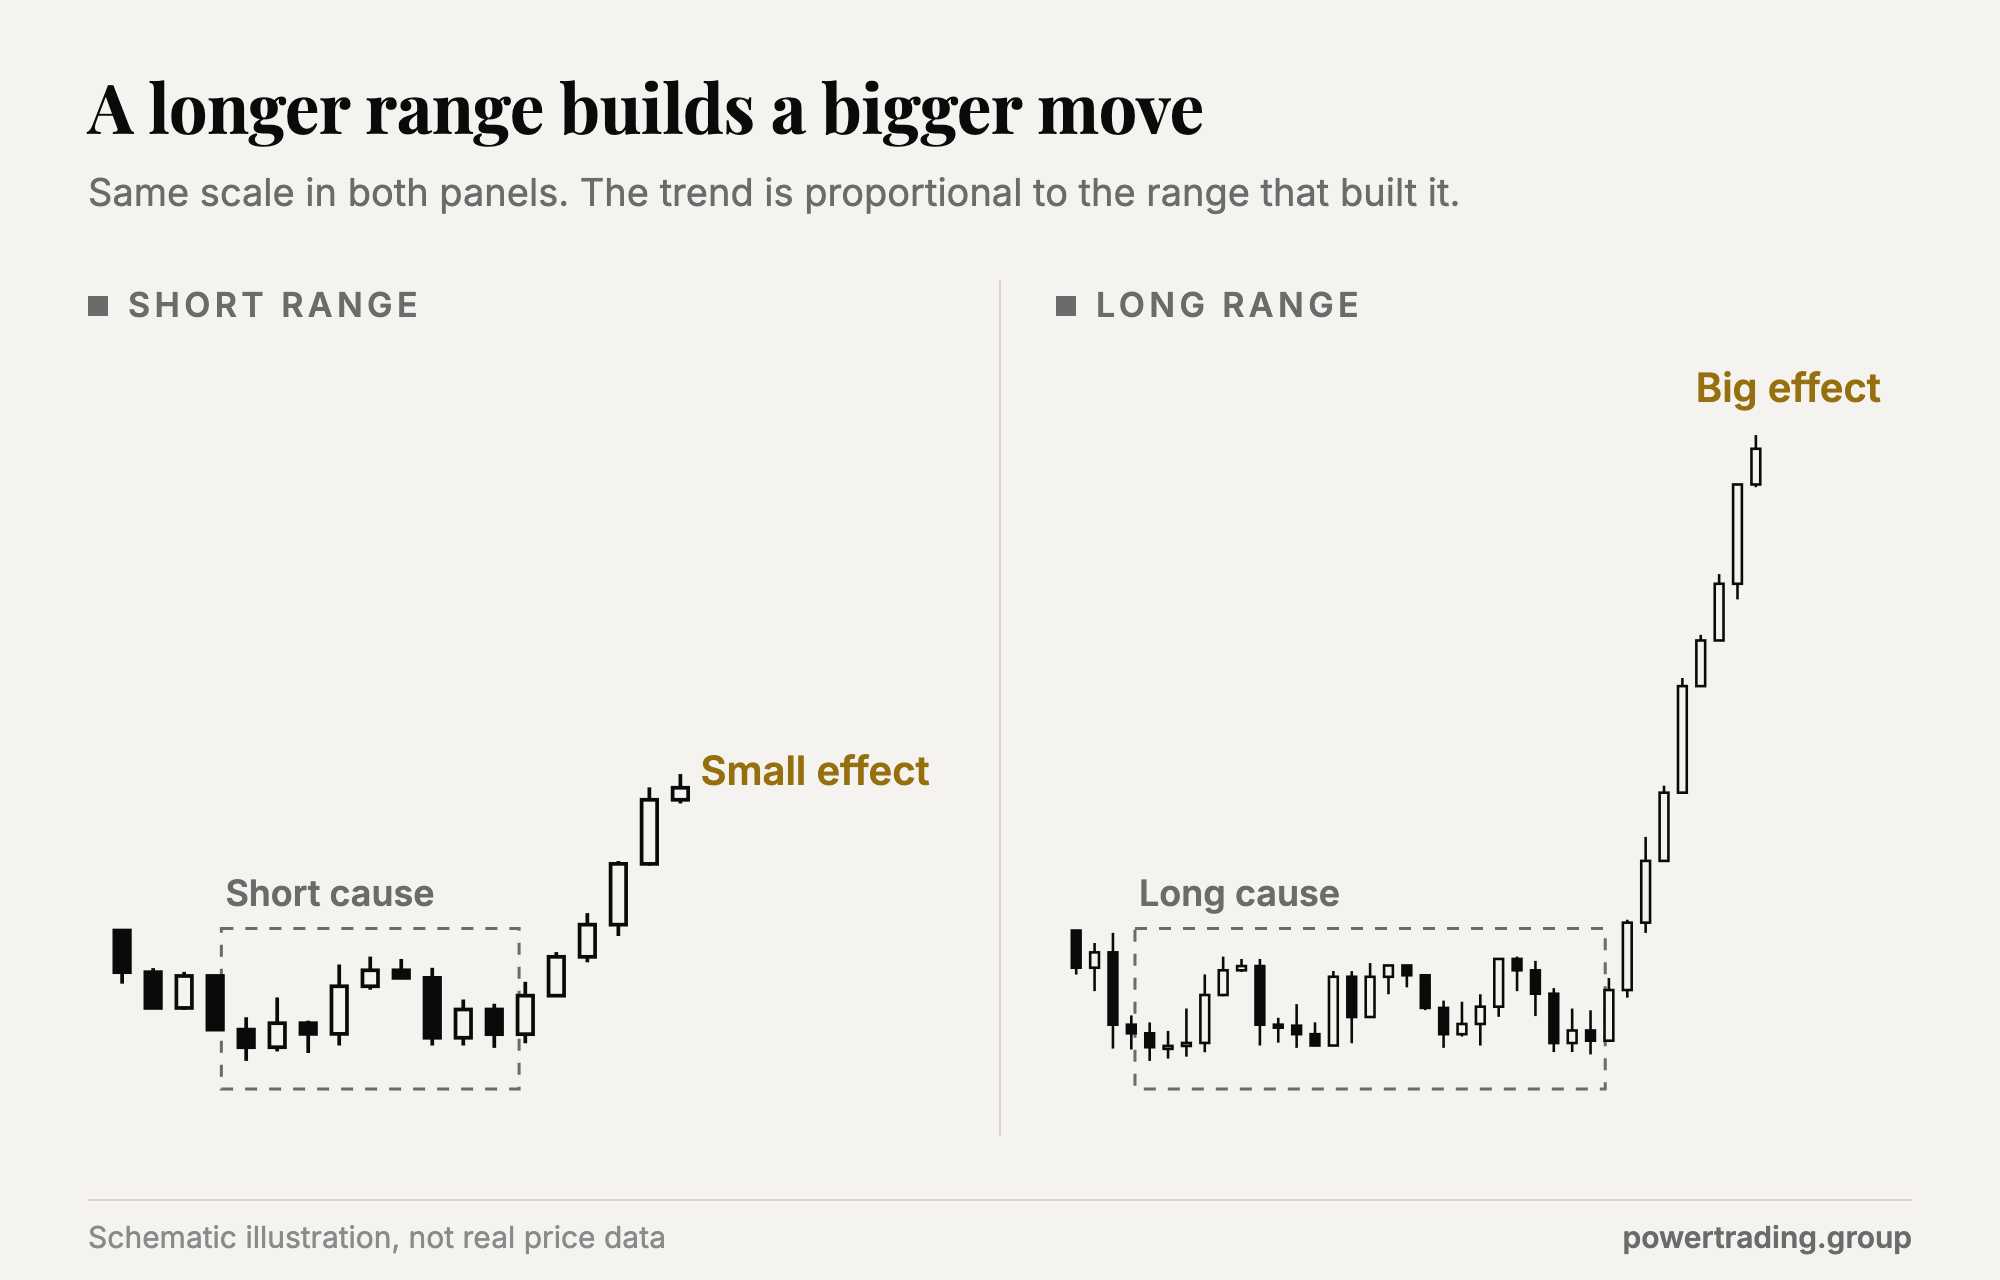
Cause and effect: a trend (the effect) is proportional to the sideways range that built it (the cause). A long, well-tested range sets up a bigger move than a short, sloppy one.
Effort versus result: volume is the effort and price movement is the result. When they agree, the move is healthy. When heavy volume produces almost no price progress, someone is absorbing the other side.
The four phases of the market cycle:
Accumulation: large buyers build a position inside a range after a decline.
Markup: demand takes control and price trends higher. If you want the simplest way to trade this phase, following the trend covers it.
Distribution: large sellers unload into strength inside another range.
Markdown: supply takes control and price trends lower.
Inside accumulation, the events that matter are a preliminary support, a selling climax, an automatic rally, a secondary test, a spring (a shakeout below the range low that fails to hold), a sign of strength, and a last point of support on the pullback. Distribution mirrors the sequence from the top, with an upthrust playing the role of the spring. For the full vocabulary with chart examples, my Wyckoff method breakdown goes event by event.
Everything in that list is useful. None of it tells you what to do at 9:32 on a Tuesday.
The turning point was effort versus result
The shift came when I stopped asking which event I was looking at and started asking who was in control and where price sat relative to the range. Effort versus result answers the first question. Cause and effect answers the second.
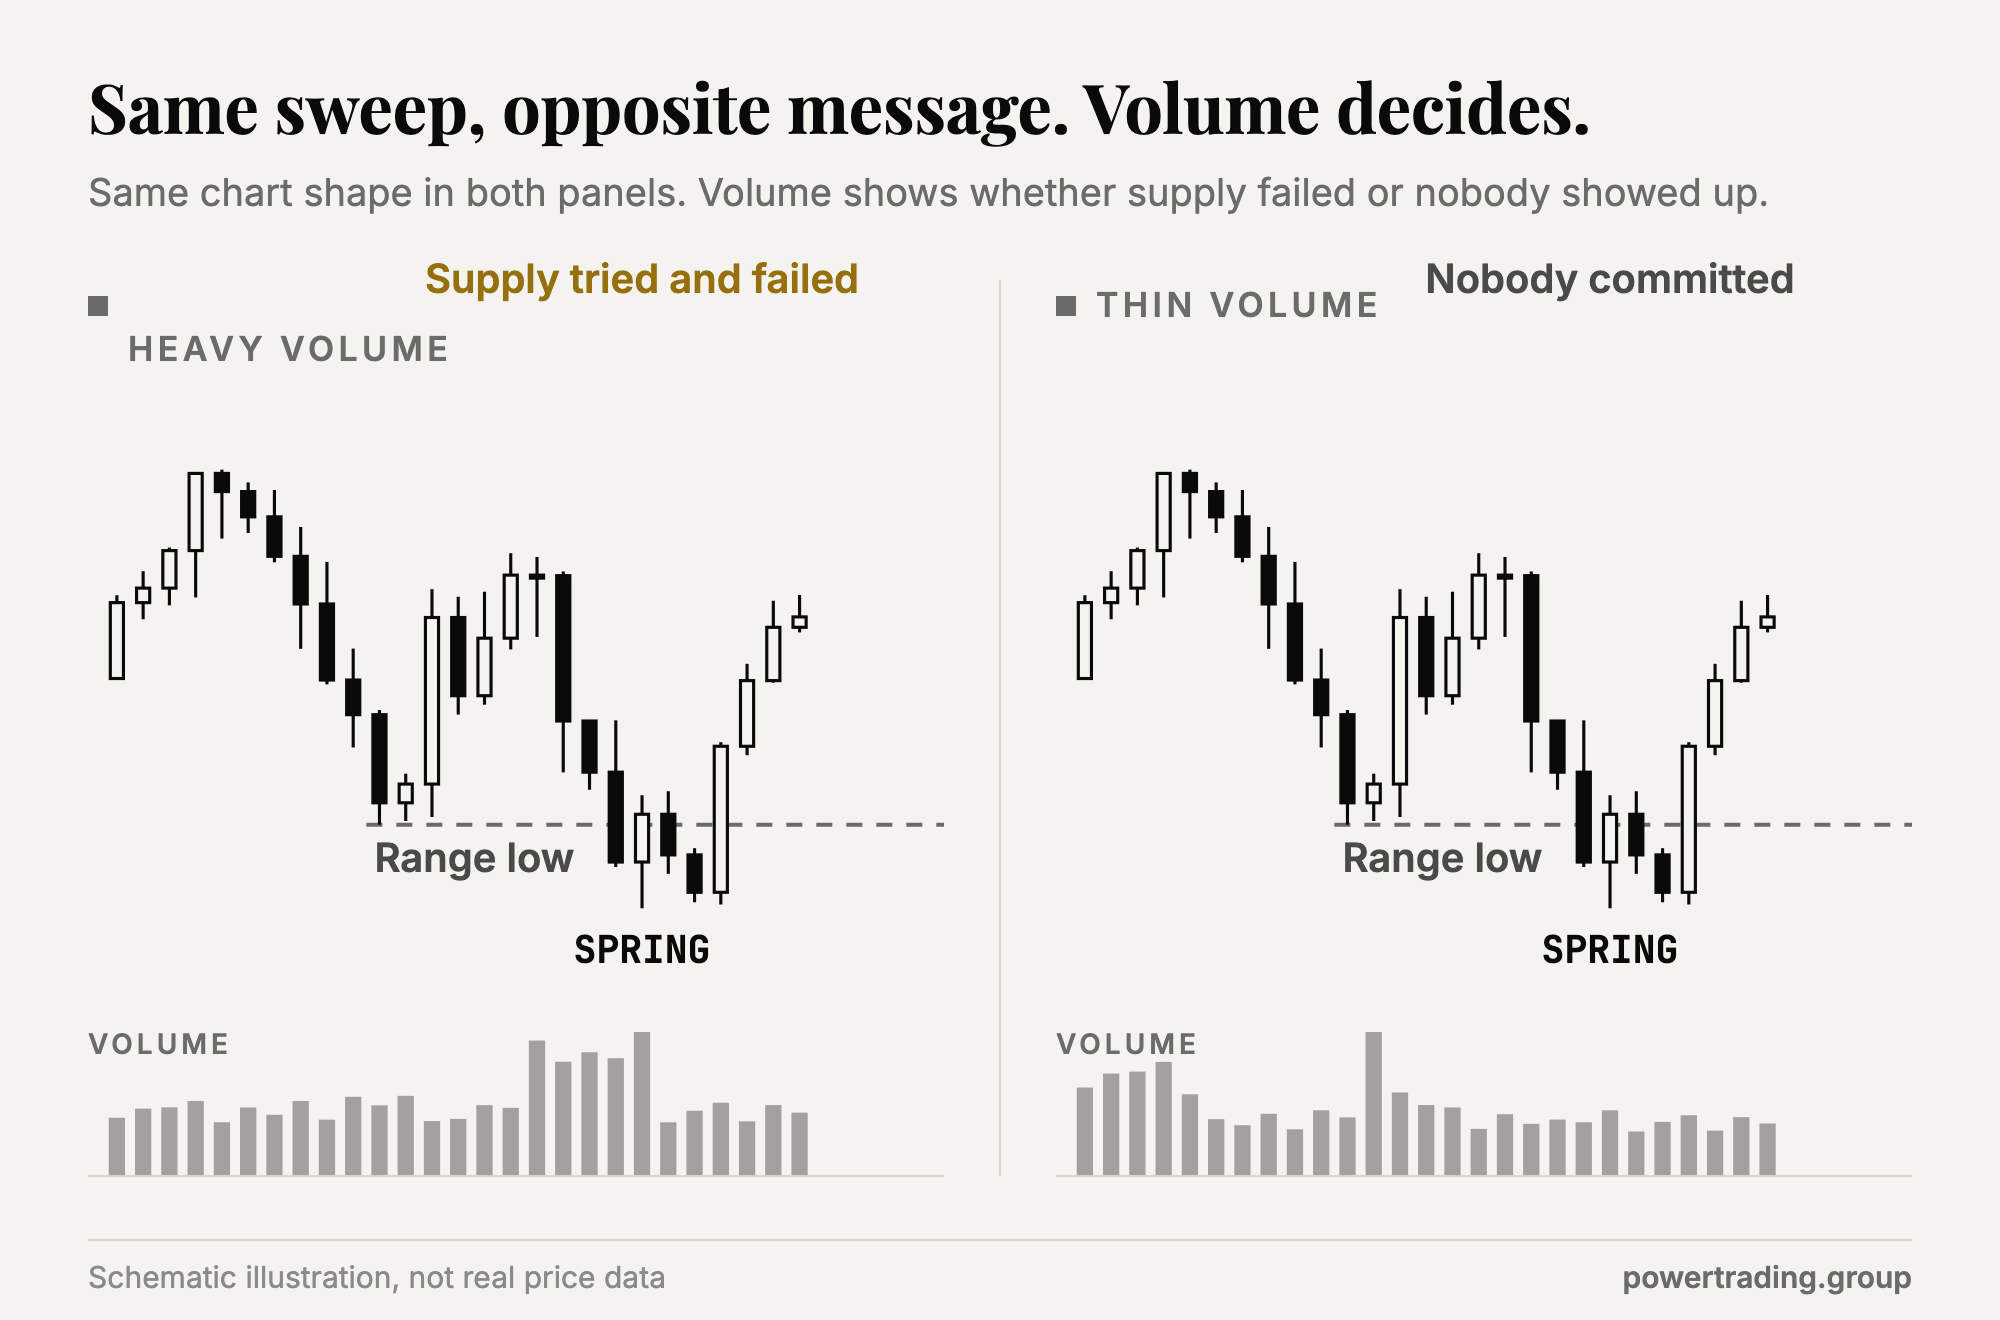
When price sweeps below a range low on a burst of volume and snaps back inside, supply tried and failed. That is information. When price drifts to the same low on thin, shrinking volume, nobody is committed, and a spring label on it is decoration. The chart shape is identical and the message is opposite.
Location came next. A Wyckoff event only carries weight at a meaningful edge of a range with a real cause behind it. A bounce in the middle of nowhere, or off a level that happens to be convenient, is a coin flip dressed in terminology. It's also why I treat market structure as a map of where decisions get made rather than a gallery of patterns to match.
The five-step filter I use now
Wyckoff's classic approach runs five steps. I turned them into a gate that a trade has to pass before I put size on:
Read the trend and the current phase. Is NQ in markup, markdown, or a range that is accumulating or distributing? If I can't answer in one sentence, I'm not trading yet.
Measure the cause. How long and how well tested is the range? A range built over several sessions justifies a bigger expectation than 30 minutes of chop.
Locate the edge. Is price at the top or bottom of that range, or at a level I planned to act on? My premarket map settles this before the open, which is why the plan comes before the chart.
Check effort versus result. Did volume and price agree at the edge, or did something get absorbed? A failed breakdown on heavy volume reads differently from a quiet drift.
Grade it, then act or pass. If it matches the setup I planned for, I take it. A B-grade trade I didn't plan for gets passed.
That fifth step is the one the textbooks skip. A Wyckoff reading can be correct and still not be your trade.
Back to the morning at the previous day's low
Run that bounce through the filter. Step three is where it stumbled: my plan named the overnight low spring and the structural longs near 28k, and this location was neither. The previous day's low, the Fib buy zone and VWAP did stack into real confluence, which is why I graded it a B or B+ instead of ignoring it. Confluence at an unplanned level is still a different trade from the one I prepared to execute.
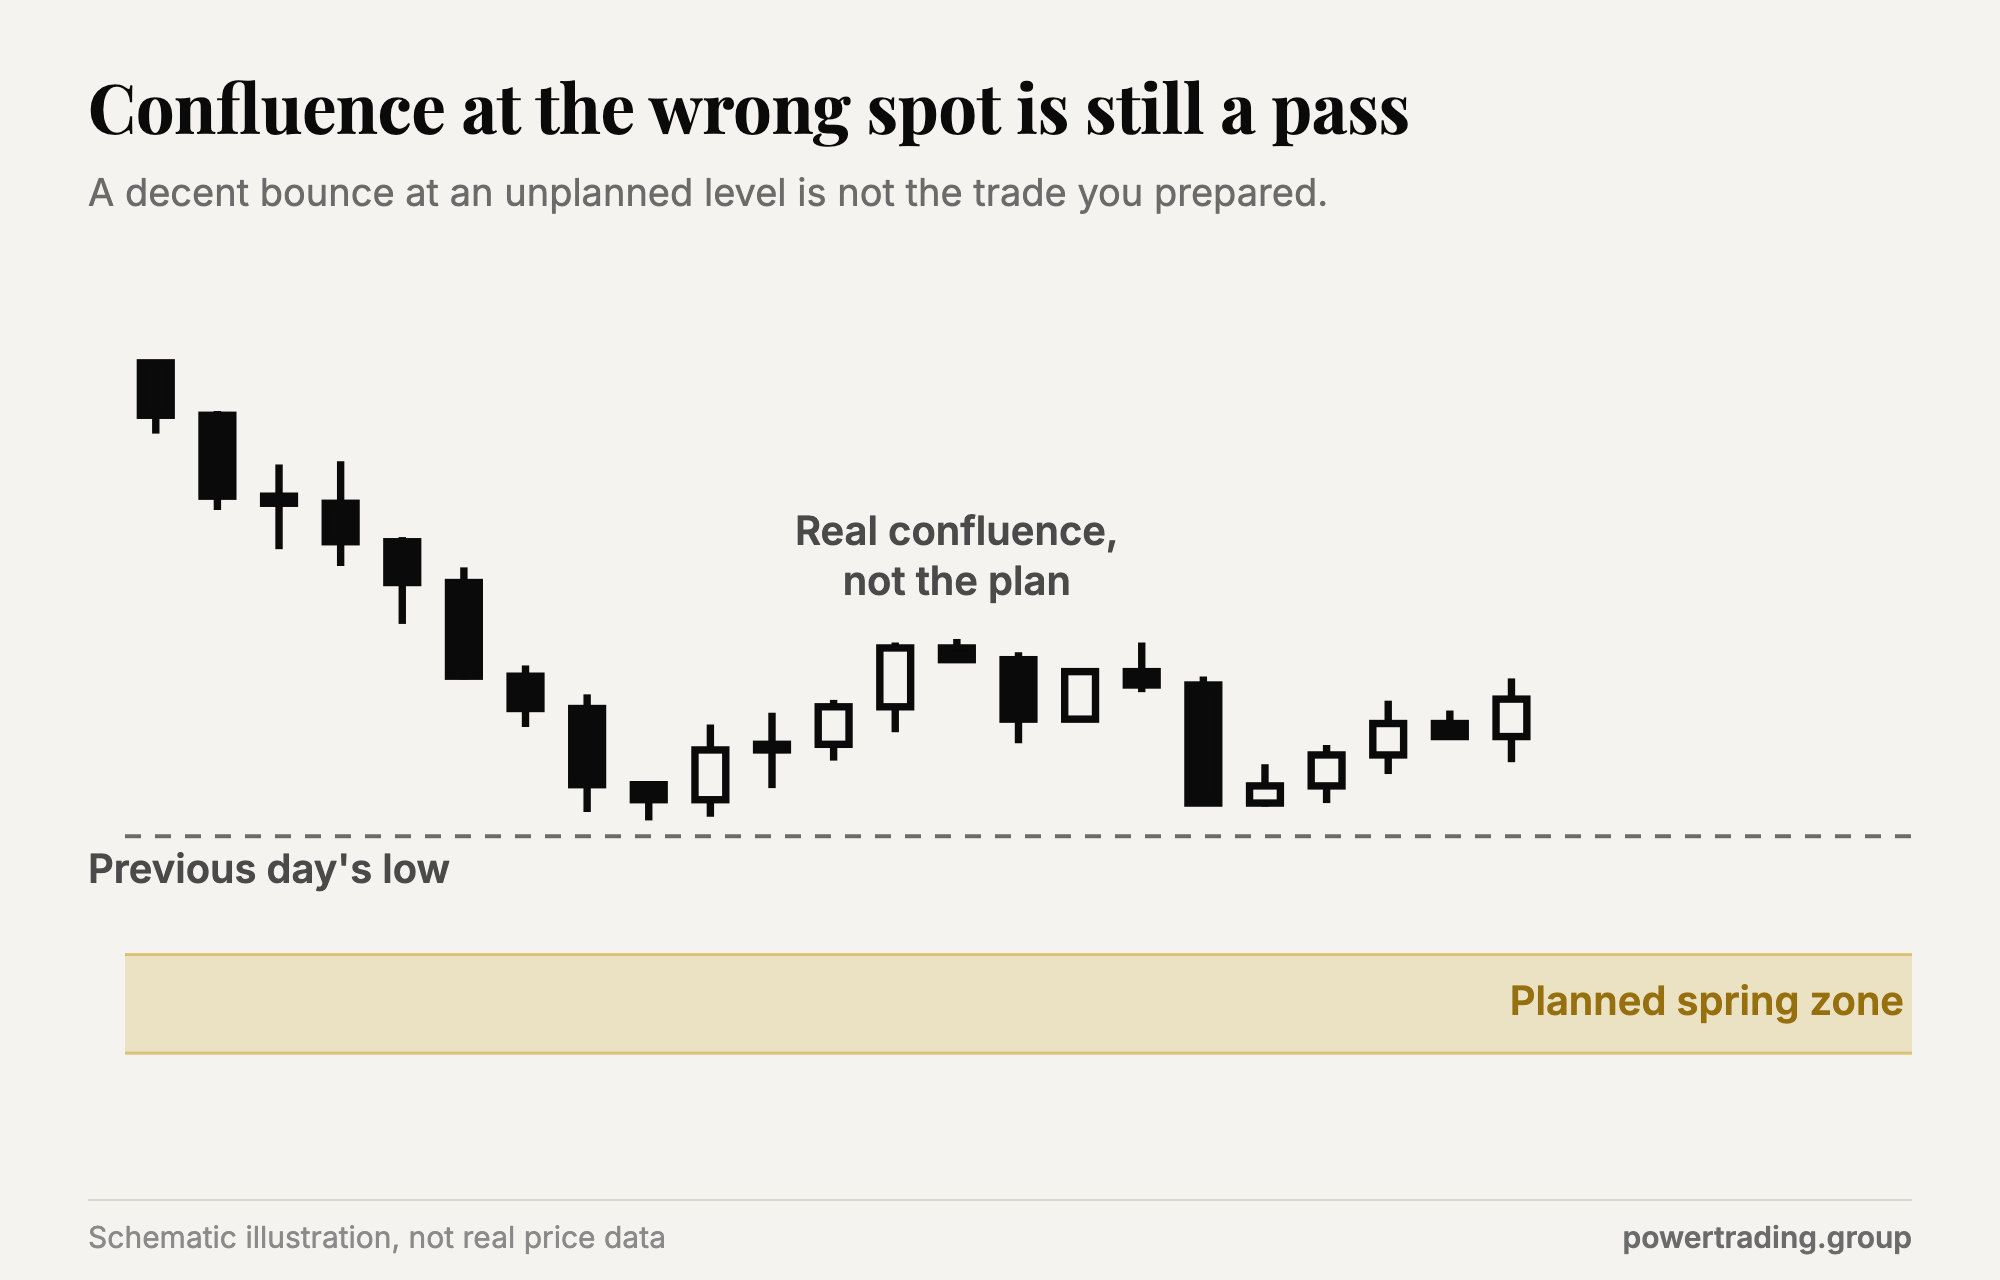
Under my old habits I'd have found a Wyckoff label for it and bought. Under the filter, it was a decent-looking opportunity outside the plan, so I let someone else have the scalp. The two-to-five minute window passed, nothing clean showed up, and the session ended flat.
That counts as a successful morning. Nothing in the log looks heroic, and nothing in it cost me money either.
Does the Wyckoff method still work?
Futures trade nearly around the clock, a different environment from the stock tape Wyckoff studied. The mechanics carry over anyway. Auction markets still move on supply and demand, ranges still build the energy for trends, and volume still shows whether price is being accepted or rejected. What changed is speed. A spring on a daily chart takes days to unfold, and the same structure on a 5-minute or 2-minute NQ chart can resolve inside an hour.
That speed makes discipline matter more. The methodology gives you a read on who is in control. It gives you no permission to trade every read.
I've traded the spring pattern by hand for years, and it now runs as one of the strategies inside AutoPilot Trader: a Wyckoff-based pattern on a faster chart that behaves independently of the Two Hour Trader strategy. The rules do the grading, so there is no temptation to promote a B-grade bounce. Every published figure for it sits on the APT performance page, labeled as simulated, with drawdowns printed next to returns. If you'd rather learn the manual version first, the spring setup walkthrough shows how I identify and trade it.
What the filter looks like from the member side
A verified-style description of the labeling phase came from one of our members:
"Prior to joining, I was a predictor and anticipator. I didn't have proper rules of engagement. Since joining, I have learned to be patient and actually learned to trade." - Robert Onsomu
Robert's predictor and anticipator phase is the labeling phase I described above, and rules of engagement is exactly what the five steps give you. Another member put the focus of our room this way:
"Unlike other gurus who may focus on trying to sell you indicators, Kyle has a singular focus on helping his members execute, with an emphasis on simplicity and discipline." - EH
Execution is where Wyckoff either pays or doesn't. Knowing the theory of a spring has never been the hard part. Holding off on the 10 bounces that aren't one is.
Put the method to work this week
You can rebuild your own version of the filter in a few sessions:
Mark ranges, skip the labels. Pull up the last ten NQ sessions on a 30-minute chart and draw only the ranges and their edges. Note which ranges had a clear cause and which were noise.
Write the plan before the open. Name the one or two locations where you would act. If price shows up somewhere else, grade it out loud and pass.
Score effort versus result at every edge. Heavy volume with no progress and quiet drift mean different things, so write down which one you saw.
Log cash mornings as wins when you followed the plan. My trading discipline guide covers how to track that so it sticks.
If you want one focused setup to build this around, the Two Hour Trader course teaches a single high-probability entry in 43 minutes. And if you'd rather watch the filter run in real time, in our Trader's Thinktank community we post the 8:45 AM ET game plan and then trade the open by hand on a shared screen for the first 90 to 120 minutes of every session. You see the plan, the grading and the passes as they happen, and the Thinktank coaching calls pick apart the mornings where the chart tempted us off the plan. Building a real edge also takes more than one tool, and the five pillars of trading edge lays out the rest.
Take the plan to the open
The B+ bounce off the previous day's low is the kind of trade that used to pull me in, and every part of it looked respectable. Wyckoff taught me to ask who is in control, where the edge is, and whether this is the trade I came to take. Some days the answer to the last question is no, and the right Wyckoff trade is the one I let go by.