
What is RVOL in Trading? How to Use Relative Volume to Filter High-Probability Setups
Most traders treat volume like background noise. They glance at it, maybe notice when it's "high" or "low," but never really use it as a decision-making tool. That's a mistake.
Relative volume - RVOL - is the single most powerful filter for separating tradeable opportunities from time-wasting chop. After 10+ years of trading NQ futures every single day, I can tell you this: without volume confirmation, you're just guessing at support and resistance levels that might not actually matter.
Here's what you need to know about RVOL, how to interpret it correctly, and how to integrate it into your trading routine without overcomplicating your process.
What is RVOL in Trading?
Relative volume (RVOL) measures how current trading volume compares to average volume over a specified period. It's displayed as a ratio.
Simple example: If NQ is trading at 2.5 RVOL, that means it's doing 2.5 times its normal volume at this specific time of day.
This is crucial: RVOL adjusts for time of day. Raw volume numbers are misleading because the market open always has higher volume than mid-day. RVOL accounts for this by comparing current volume to the average volume at that same time historically.
A good RVOL indicator will show you:
Current volume vs. average volume (the ratio)
Time-of-day-specific comparison (not just a rolling average)
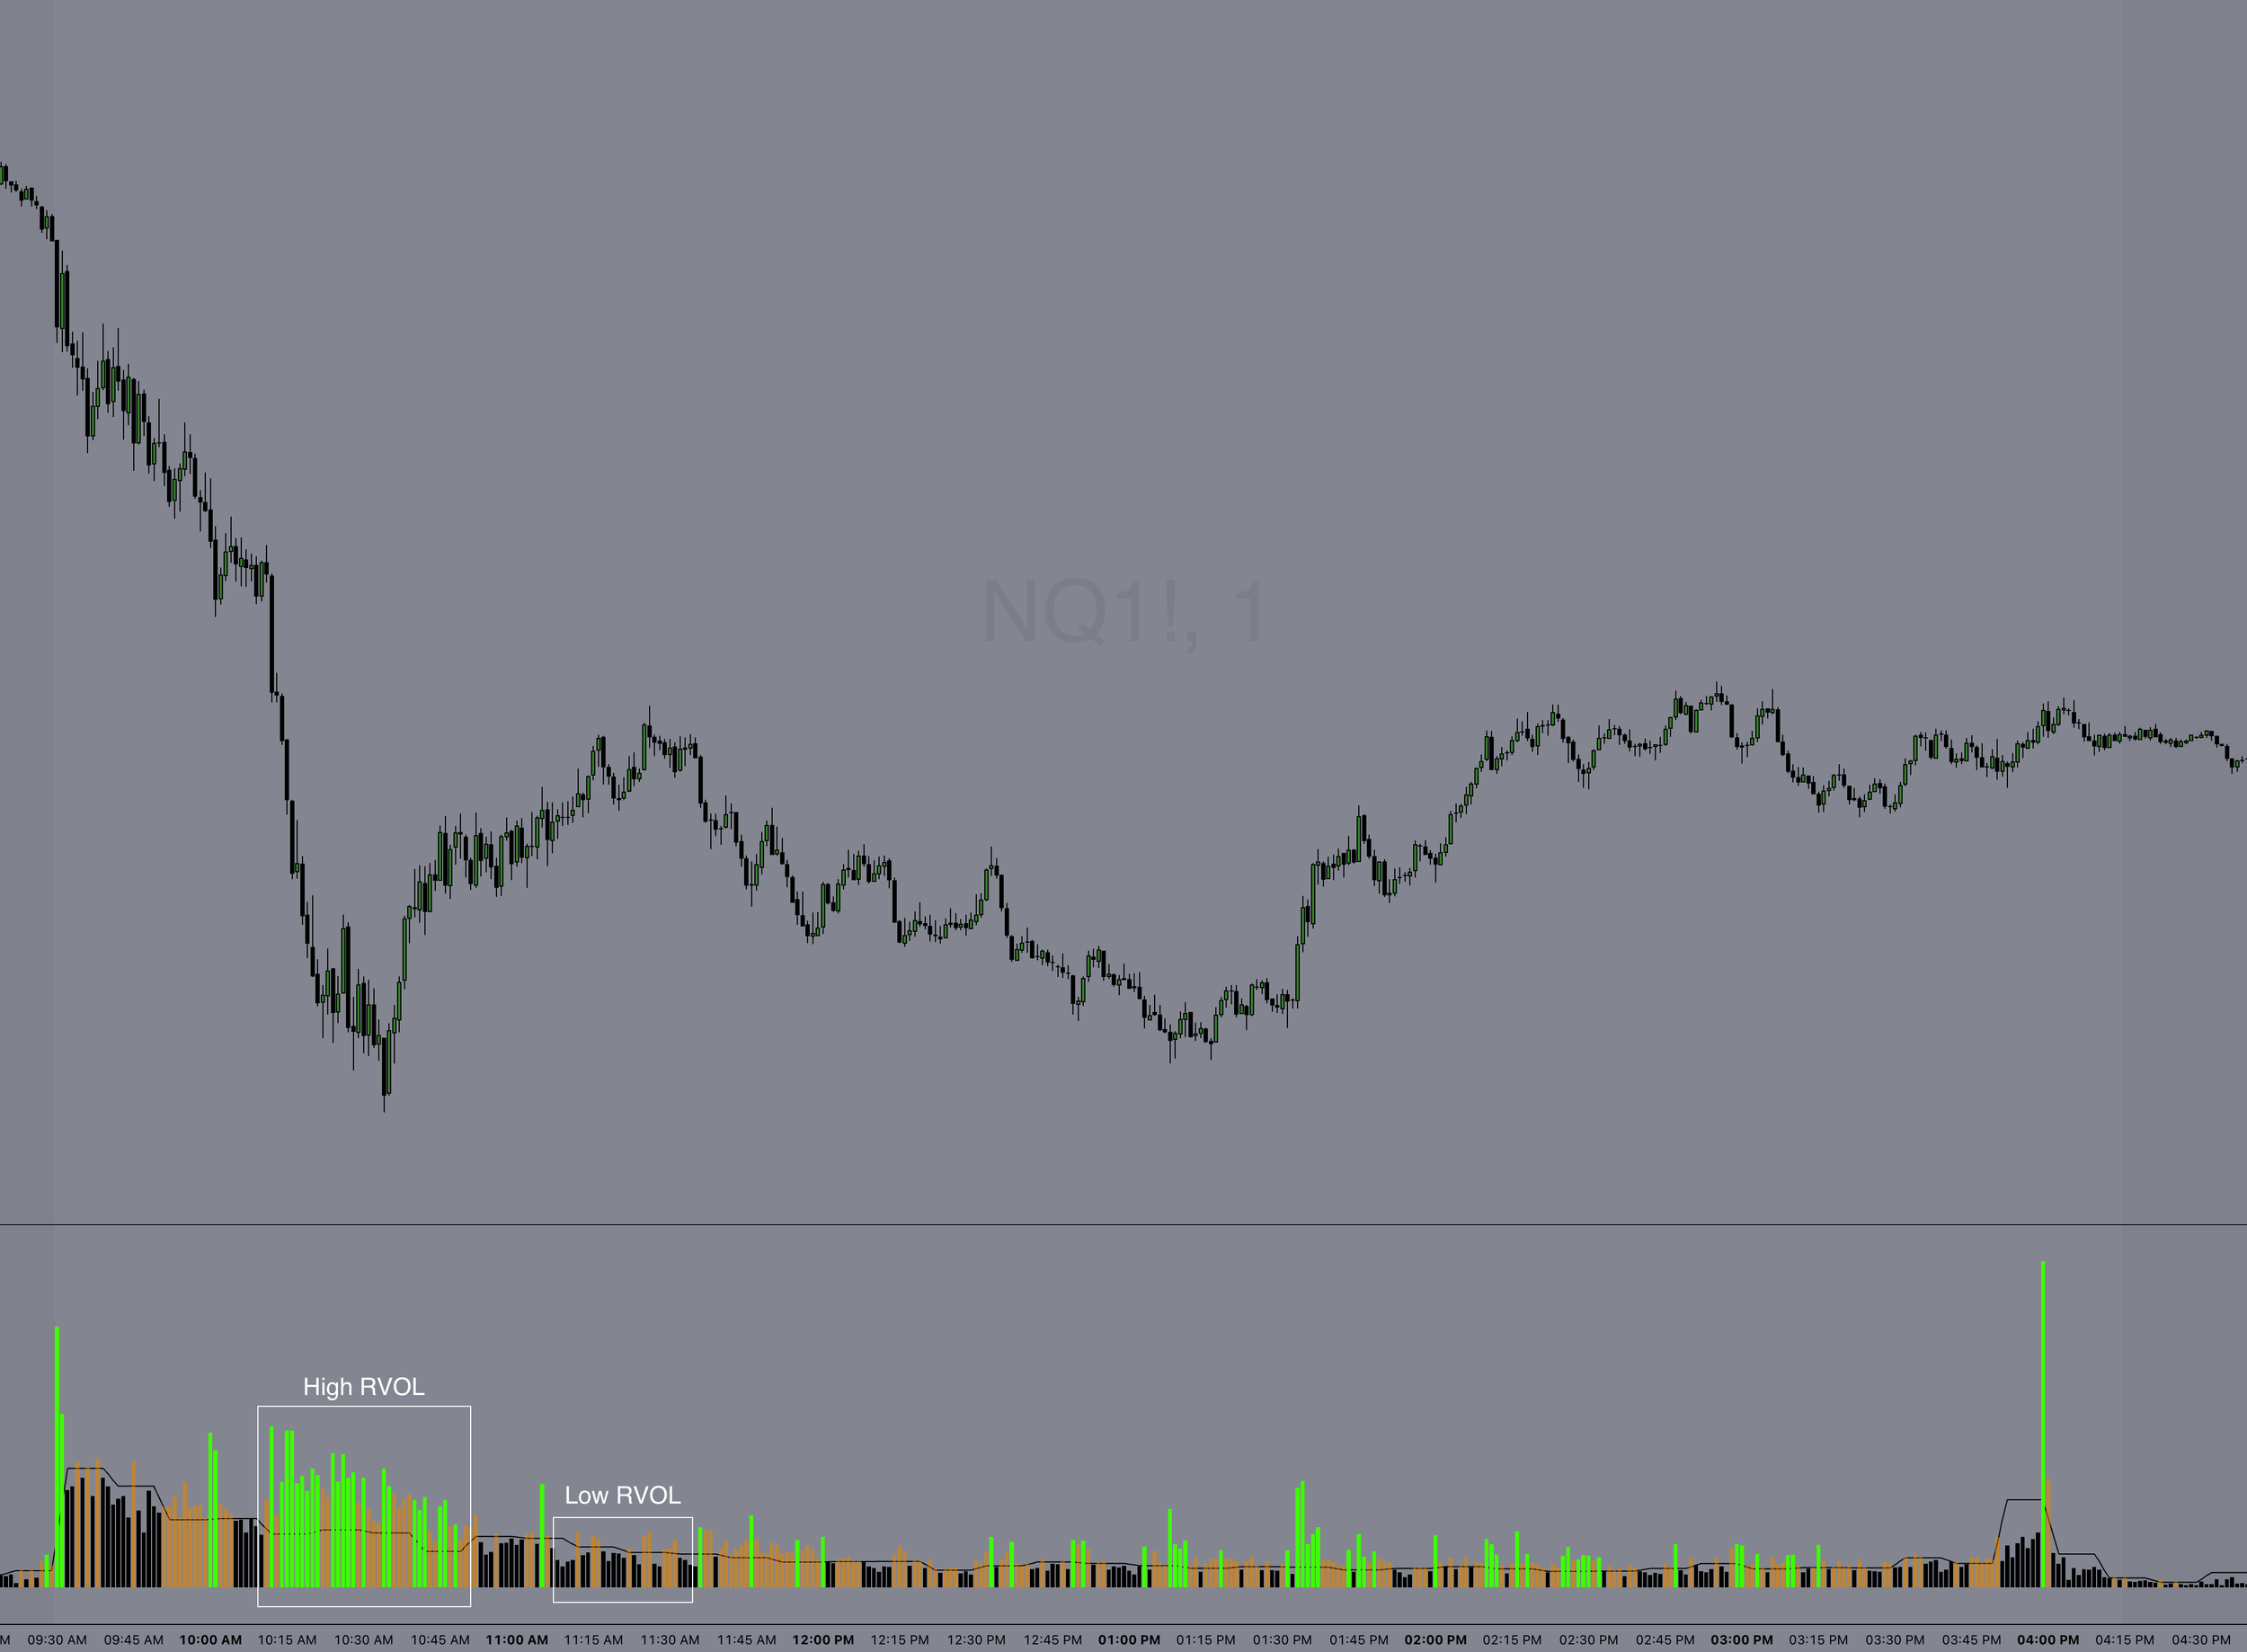
Visual representation (color gradients work well - our TradingView indicator uses gray for <1 RVOL, red for 1-1.5x, orange for 1.5-2x, yellow for 2-3x, and bright green for >3x)
Why this matters: Volume represents force. For price to sustain a move or hold a key level, you need volume. Without it, price gets pulled back like gravity. RVOL tells you when that force is present.
How to Calculate and Interpret RVOL
Most platforms don't natively show RVOL (which is absurd, given how critical it is). Here's what's happening under the hood when you use a proper RVOL tool:
The Power Trading Group RVOL indicator for Tradingview
Calculation:
RVOL = Current Volume / Average Volume at This Time
Example with NQ futures:
It's 10:15 AM ET
NQ has traded 45,000 contracts so far today
Historical average volume at 10:15 AM: 18,000 contracts
RVOL = 45,000 / 18,000 = 2.5 RVOL
Interpretation thresholds:
<1.0 RVOL: Below average. Stock or futures contract is not "in play." Skip it.
1.0-1.5 RVOL: Average. Might be tradeable, but you're not getting institutional attention yet.
1.5-2.0 RVOL: Elevated. Worth watching if you have a technical setup.
2.0-3.0 RVOL: High. This is where you should be paying close attention. Combine with a strong technical setup and you've got a high-probability trade.
>3.0 RVOL: Extreme. Major event or news catalyst. High volatility - manage risk accordingly.
Here's the key insight most traders miss: RVOL alone doesn't tell you direction. It tells you something is happening. You still need price action, structure, and a trading framework to know which way to trade it.
Using RVOL to Filter High-Probability Trades
I use RVOL as a qualification filter, not an entry signal.
My process:
Identify a technical setup (pullback to a key level after a break of structure, rejection at resistance, etc.)
Check RVOL
If RVOL is below 1.5x, I'm skeptical. The setup might work, but it's lower probability.
If RVOL is above 2x, I'm paying full attention. Now the setup has the volume force to follow through.
Real NQ futures scenario (from recently):
NQ was consolidating near 20,500 after a strong overnight rally. At 9:45 AM ET, it broke above 20,525 (a key resistance level we'd been watching in our Trader's Thinktank Premarket Prep), then pulled back to 20,530 - just above the breakout level.
Without RVOL: You might skip the pullback entry, or take it blindly without volume confirmation and get chopped out if it fades back into range.
With RVOL: I checked volume when the pullback formed. RVOL was 2.8x. That told me institutions were still engaged despite the pullback. The initial move had real force behind it, and this pullback was a high-probability re-entry. I took the long at 20,532, and NQ ran to 20,585 within 30 minutes. Volume confirmed the move was real.
Contrast that with a different session two days later: NQ broke the same level (20,525) at 11:15 AM, but RVOL was only 0.9x. The pullback looked identical on price action alone, but I passed. Sure enough, it faded back into range within 10 minutes. No volume, no follow-through.
This is the difference RVOL makes.
RVOL + NQ Futures: Real Trading Scenarios
Let's walk through how I use RVOL with NQ intraday.
Scenario 1: The Post-Breakout Pullback Entry
Setup: NQ forms a tight 30-minute opening range (9:30-10:00 AM ET) between 20,450 and 20,475. At 10:05 AM, it breaks above 20,475, pushes to 20,485, then pulls back to 20,478.
RVOL check:
RVOL = 2.6x during the initial move → This is a high-probability pullback entry. Volume supported the breakout, and now price is offering a lower-risk entry on the retest. I'm looking to enter the pullback with a stop below 20,475.
RVOL = 1.1x during the initial move → Pass. Breakouts without volume fail more often than they work, and pullbacks after weak breakouts are even riskier. Wait for better confirmation or a different setup.
Scenario 2: The Failed Breakdown
Setup: NQ drops below a key support level (20,400) at 2:00 PM ET, but immediately reverses and reclaims it.
RVOL check:
RVOL = 3.2x → Strong reversal. Volume spiked on the failed breakdown, signaling buyers stepped in aggressively. This is a high-probability long.
RVOL = 0.8x → Weak reversal. Without volume confirmation, this could just be a temporary bounce before continuing lower. I'd need more proof before entering.
Scenario 3: The Midday Chop
Setup: NQ is oscillating between 20,450 and 20,475 from 11:30 AM to 1:00 PM.
RVOL check:
RVOL = 0.6x → Exactly. Low volume = low conviction = range-bound chop. This is when I walk away from the screens. No high-probability setups exist in low-volume environments. Save your capital and focus for when RVOL picks back up.
This is the practical application. RVOL doesn't give you entries, but it tells you when to be aggressive and when to stand down.
Common RVOL Mistakes Traders Make
Mistake #1: Trading High RVOL Without a Technical Setup
High RVOL doesn't mean "go long" or "go short." It means "pay attention." You still need a reason to enter - a pullback to support, a rejection at a key level, a break of structure with a retest. RVOL without structure is just noise.
Mistake #2: Ignoring Time of Day Context
A stock doing 2x volume at 9:35 AM is normal. A stock doing 2x volume at 2:00 PM is significant. Always consider what time it is. Good RVOL tools adjust for this automatically.
Mistake #3: Using Raw Volume Instead of RVOL
"NQ traded 200,000 contracts today" tells you nothing. Is that high? Low? Average? You can't know without the relative comparison. Always use RVOL, not raw volume.
Mistake #4: Assuming RVOL = Direction
RVOL tells you force is present. It doesn't tell you if that force is bullish or bearish. You need price action and market structure to determine direction. RVOL is a filter, not a signal.
Mistake #5: Chasing Extreme RVOL (>4x)
When RVOL spikes above 4x, you're usually late. This level typically indicates a major news event or climactic move. By the time you see it, the easy money is gone. I use extreme RVOL as a "stay out" signal unless I'm already in the trade.
RVOL vs. Other Volume Indicators
Traders often confuse RVOL with other volume tools. Here's how they differ:
RVOL vs. Raw Volume
Raw volume = total contracts or shares traded. RVOL = volume relative to historical average at this time of day.
Raw volume is useless for intraday trading because it doesn't account for normal volume patterns. RVOL gives you context.
RVOL vs. Volume Profile (VPOC)
Volume Profile shows where volume occurred at specific price levels. RVOL shows how much volume is happening right now compared to normal.
These are complementary. Volume Profile tells you where institutions accumulated or distributed. RVOL tells you if they're active right now. I use both - VPOC for key reference levels, RVOL to confirm if those levels will hold or break.
RVOL vs. On-Balance Volume (OBV)
OBV is a cumulative indicator that adds/subtracts volume based on whether price closes higher or lower. RVOL is a real-time ratio showing current activity vs. average.
OBV is useful for longer timeframes and trend confirmation. RVOL is better for intraday decision-making.
Bottom line: RVOL is the most actionable volume indicator for day traders. It's simple, real-time, and directly applicable to trade filtering.
How to Add RVOL to Your Trading Routine
Here's how I integrate RVOL into my daily process:
Step 1: Premarket Prep (8:45 AM ET)
I review overnight action and key levels for the day. I don't check RVOL yet - the regular session hasn't opened. But I'm mentally prepared to monitor it once 9:30 AM hits.
Step 2: Market Open (9:30-10:00 AM ET)
During the first 30 minutes, I watch RVOL closely. If NQ is trading with 2.5+ RVOL at the open, I know we're in for an active session. If RVOL is below 1.5x, I adjust expectations - today might be range-bound or choppy.
Step 3: Setup Qualification (Throughout the Session)
Every time I see a potential trade setup, I check RVOL before entering. If RVOL is below 1.5x, I'm cautious. If it's above 2x, I'm aggressive with position sizing (within my risk limits).
Step 4: Midday Filter (11:00 AM - 1:00 PM ET)
Volume almost always drops midday. If RVOL falls below 1.0x, I step away. There's no edge in low-volume chop. I'll come back at 1:30 or 2:00 PM when volume typically picks up again.
Step 5: Close (3:30-4:00 PM ET)
Volume surges into the close. RVOL will naturally increase. I'm more selective here - high RVOL at the close often means erratic moves driven by institutional rebalancing, not clean technical setups.
The key is consistency. RVOL isn't something you check once and forget. It's a real-time filter you reference throughout the session.
How We Use RVOL in the Trader's Thinktank
Every morning at 8:45 AM, I publish Premarket Prep notes for our community. These include specific NQ levels to watch, economic data, and a game plan for the session.
Once the market opens, I'm livestreaming my screen and calling out RVOL in real time. When I see a setup developing, I'll say something like: "NQ breaking 20,525 here, RVOL is 2.4x, I'm watching for a pullback entry." That real-time volume context helps traders understand why I'm taking certain trades and passing on others.
We also discuss RVOL in our weekly group coaching calls. Members submit their trades for review, and one of the most common mistakes we see is taking technically sound setups during low-volume periods. Adding RVOL as a filter eliminates most of those losing trades.
The Two Hour Trader + RVOL
One of the setups I teach in The Two Hour Trader framework is heavily dependent on RVOL confirmation. The setup itself is simple - a specific price action pattern that appears during the first two hours of the session. But the difference between a 70% win rate and a 50% win rate on that setup is RVOL.
When RVOL is above 2x, the setup has an 82% win rate (based on my own tracked data over the last 18 months). When RVOL is below 1.5x, that win rate drops to 64%.
This is why I automated the exact same framework with AutoPilot Trader. The algorithm includes proprietary volume filters that account for RVOL thresholds. It only takes trades when volume confirms the setup. No emotions, no second-guessing - just systematic execution when conditions align.
The result? 69.8% win rate across 1,045 trades with a 3.58 Sharpe ratio. Volume filtering is a big part of why those numbers are possible.
Final Thoughts
RVOL is not a magic indicator. It won't tell you when to buy or sell. But it will tell you when to pay attention and when to stand down.
Most traders lose money because they trade when they shouldn't - during low-volume chop, during lunch, during sessions with no institutional participation. RVOL solves that problem. It's a filter that keeps you out of low-probability environments and focused on high-probability setups.
If you're not using RVOL, you're trading blind. Add it to your routine. Check it before every entry. You'll immediately notice the difference in your win rate.
And if you want to see how professional traders use RVOL in real time, join us in the Trader's Thinktank. We're calling out volume context every single trading day. See what's included here.
Our Custom RVOL Indicator for TradingView
We built a custom RVOL indicator specifically for futures traders. It's only available to Trader's Thinktank members, and it's the same tool I use every single day.
What makes it different:
Color-coded volume bars - Ultra-high volume appears as forest green, very high as deep forest green, high as sage green, normal as orange, low as red, and very low as black. You can see at a glance whether current volume justifies taking a trade.
True time-based comparison - Compares current volume to the same time period on previous days, not just a rolling average. This eliminates false signals during naturally high-volume periods like market open.
5-day lookback - Uses up to 5 previous trading days to establish reliable historical baselines. This smooths out one-off volume spikes and gives you a more accurate read.
Debug mode - Optional visualization of historical volume comparisons if you want to dig deeper into the data.
This indicator is called Futures Relative Volume (RVOL) on TradingView. Once you're a Thinktank member, you can request access by posting your TradingView username in the community. We'll verify your membership and grant access within 24 hours.
Having this indicator on your chart eliminates guesswork. You'll know immediately whether a move has institutional backing and if the pullback entry is high-probability, or if you're trading into a low-volume fade.
If you're trading alone and trying to figure out volume analysis on your own, you're fighting with one hand tied behind your back. Having experienced traders point out these patterns in real time accelerates your learning dramatically. Learn more about the Trader's Thinktank here.