
Support and Resistance: The Foundation Every Serious Trader Needs to Master
Most traders treat support and resistance like a beginner concept. Something you learn in week one, nod at, and then move past when you start chasing indicators and oscillators.
That's a mistake I made early in my career, and I've watched hundreds of traders repeat it.
Here's the reality: after 10+ years of trading NQ and ES futures full-time, support and resistance is still the first thing I look at every single morning. Not my indicators. Not the news. The levels. Where did price respect yesterday? Where is it likely to react today? That's where the analysis starts, and often, that's where it ends.
If you've been around the markets for any length of time, you've encountered this concept. But there's a significant gap between knowing what support and resistance is and actually using it to make money. This article is about closing that gap.
What Support and Resistance Actually Are
At its most basic level, support is a price area where buyers have historically shown up in enough force to stop a decline. Resistance is the opposite: a zone where sellers have overwhelmed buyers and pushed price back down.
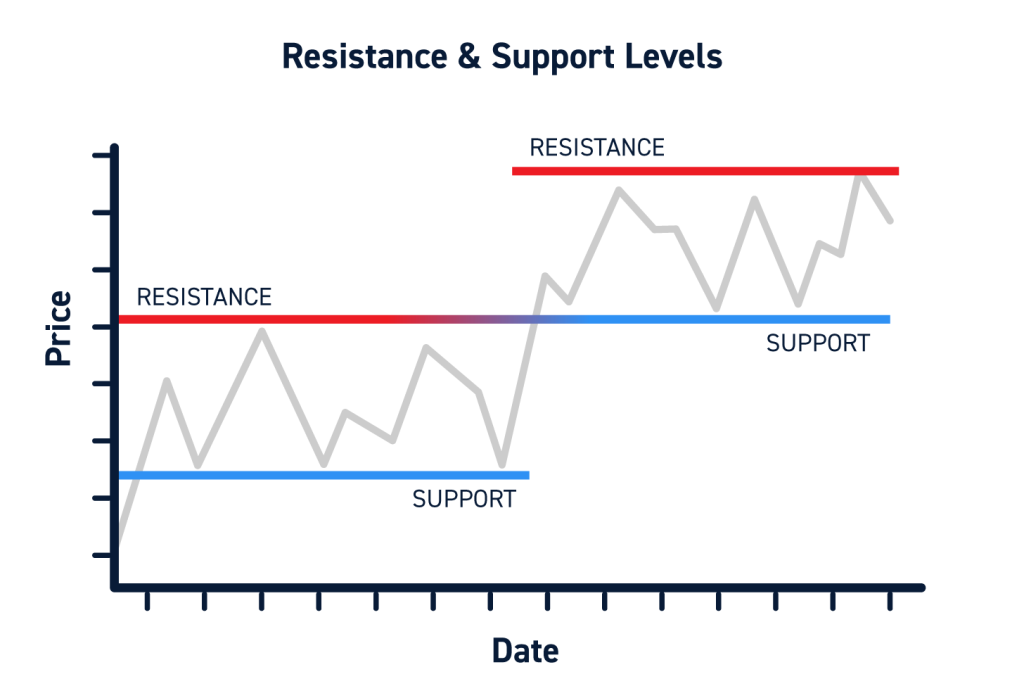
But that definition, while accurate, misses the deeper mechanism. Support and resistance aren't just lines on a chart. They're the physical record of where market participants made decisions. Every time price touches a prior swing low and bounces, you're watching the collective memory of the market playing out in real time. Traders who bought there before remember it worked. New traders see the level and buy in anticipation. Algorithms trigger orders at those prices. The level matters because people make it matter.
This is why support and resistance actually works. It's not a self-fulfilling prophecy in a cheap sense. It's a genuine aggregation of human decision-making at specific price points.
Support Becomes Resistance, and Vice Versa
One of the most powerful (and frequently underused) concepts in price action trading is the idea of polarity. When price breaks below a support level convincingly, that old support often flips and becomes resistance on any subsequent rally back to that area.
The logic is straightforward. Traders who bought at the support level are now underwater. When price rallies back to their entry, many of them will sell to get out at breakeven. That selling pressure creates resistance where support used to be.
Understanding polarity lets you anticipate reactions that look confusing if you're just watching the price blindly. A level that bounced price three times to the upside is highly likely to act as a ceiling the first time price approaches it from below. Understanding market structure in depth is what transforms polarity from a concept into a tradeable edge.
Why Most Traders Draw Levels Wrong
I want to be direct here because this is where I see even intermediate traders go off the rails.
Support and resistance are not precise lines. They're zones. Price rarely turns on a single tick. It probes, wicks, tests, and then reverses. If you draw a line and expect price to stop at that exact pixel on your chart, you're going to get stopped out of perfectly good trades because you gave zero room for the natural noise of the market.
Here's how I think about it instead. I'm looking for a zone, usually defined by two reference points: the body of a significant candle and the wick of that same candle (or a nearby candle). The zone between those two prices is where I expect reaction. I'm not expecting price to reverse exactly at $21,340. I'm expecting reaction somewhere in the $21,330 to $21,360 range.
The second mistake is drawing too many levels. I see traders with charts covered in horizontal lines every 20 points. At that point, the levels are meaningless because there's always one nearby. You want to identify the levels that actually matter, and that means being selective. Price action trading becomes far simpler when you're working with 3 or 4 significant levels rather than 20.
For members in the Thinktank, this process is handled by PTG Levels of Interest, an invite-only TradingView indicator included with the Trader's Thinktank membership. It marks NQ's key areas automatically, drawing them as regions rather than thin lines, which reflects exactly the zone-based approach described above. Price often pokes through an area before it turns, so that room to breathe matters. The indicator locks each morning at 8:00 AM ET, doesn't repaint, and reads the same regardless of which chart timeframe you're on. It grew out of years of premarket prep notes and was tested against more than a decade of NQ 1-minute data, with one requirement: reproduce the areas Kyle marks by hand. It's a mapping tool, not a signal service, but having those areas already plotted before the open removes one of the most time-consuming and error-prone parts of daily preparation.
What Makes a Level Significant
Not every bounce creates a tradeable level. Here's what I look for when deciding if a level is worth marking:
Clean reversal at round numbers or obvious prior structure. Markets have a gravitational pull toward round numbers. $20,000 on NQ, $5,000 on ES. These aren't arbitrary, they represent mass decision points.
Multiple touches without breaking. One bounce could be coincidence. Two bounces at the same area starts to mean something. Three or more, and you have a level the market is clearly respecting.
The quality of the reversal. A level that produced a sharp, aggressive reversal with volume is more meaningful than one where price drifted sideways and eventually turned around. Sharp moves suggest trapped traders and genuine imbalance.
Recency. A level that held 18 months ago matters less than one that held last week. I weight recent structure more heavily, especially for intraday trading.
How I Actually Use Support and Resistance in Live Trading
Let me give you a real example of how this plays out in practice, because theory is cheap.
A few weeks back, I was tracking NQ through an extended choppy session. Price had been oscillating between the prior day low around 210 and a cluster of levels including last week's low and the volume point of control. I put in an order at one point but pulled it when volume dried up. I didn't want to be long against the 200 area without seeing real confirmation that buyers were stepping in.
For close to an hour, I watched. Price finally swept below the prior day low, flushed the late shorts, volume came in hard, and then a one-minute bar closed back above that 210 level. That's when I entered.
Afterward, I said something that I've said a thousand times in different forms:
"Today, I'm personally just happy with my patience to wait for the 200 prior day low area."
That patience, waiting for price to actually confirm the level rather than anticipating it, is what separates a support and resistance trader who makes money from one who just draws pretty lines and hopes.
In the Trader's Thinktank, we go through this kind of level identification every single morning in the Premarket Prep note. Before the market opens, members already know where the significant support and resistance zones are for the day. That context changes everything about how you approach the session.
Confluence: When Multiple Levels Stack
Support and resistance becomes dramatically more powerful when multiple levels land in the same zone. When you have a prior day low, a weekly low, VWAP, and the volume point of control all sitting within 10 to 15 points of each other on NQ, that's not coincidence. That's confluence, and it's where the highest-probability reactions happen.
I look for three types of confluence specifically:
Horizontal level plus VWAP. VWAP acts as a dynamic support and resistance level throughout the session. When a horizontal level and VWAP align, reactions tend to be sharp and clean.
Prior structure plus opening range. The first 30 to 60 minutes of the day establish the opening range. When a prior week or month high or low aligns with the opening range boundary, that level gets a lot of attention.
Round number plus high volume node. High volume nodes from the prior session's volume profile tend to attract price. When a round number sits on top of a high volume node, it creates a magnet zone that's hard to ignore.
The Wyckoff method layers beautifully on top of this kind of analysis. Understanding accumulation and distribution gives you context for why certain support zones hold while others fail. It's not just about where the levels are. It's about whether smart money is absorbing supply or distributing into demand at those levels.
What Happens When Levels Break
A lot of traders freeze when a level breaks. They bought the support, it breaks, and they don't know whether to hold, add, or bail.
Here's how I think about it. There are breaks and there are fake breaks.
A genuine break tends to have momentum behind it. Price cuts through the level with expanding volume, doesn't look back, and closes decisively below. The sellers are in control and the level has flipped.
A fake break, sometimes called a spring in Wyckoff terminology, is the opposite. Price dips below a well-defined support level, triggers the obvious stop orders sitting there, and then reverses sharply back above the level. Volume on the break is typically lower than you'd expect. Volume on the reversal is aggressive.
Learning to distinguish between real breaks and spring setups is one of the higher-order skills in this business. Our dedicated breakdown of the spring setup covers the exact mechanics of how to identify and trade this pattern. It's one of the cleanest applications of support and resistance in live markets.
A verified Trustpilot reviewer put it well after spending time with the material:
"PTG has by far been the most helpful in my trading career. They teach simple strategies that work, don't push 'the next program' on you, and actually answer questions." - Scott Rushing
That's what I'm trying to do here. Give you the framework, not a system to buy.
Support and Resistance in the Context of Trend
One more thing I want to address, because I see traders ignore this constantly.
Support and resistance doesn't exist in a vacuum. It has to be read in the context of the prevailing trend.
In an uptrend, prior resistance breaks and becomes support. Each pullback to that former resistance, now support, is a buying opportunity in the direction of trend. The pullback trading framework is built on exactly this concept.
In a downtrend, the reverse is true. Former support breaks and becomes resistance. Rallies into that area are selling opportunities.
Trading against the trend at support or resistance is the highest-risk version of this approach. You might catch a great reversal trade once in a while, but you're fighting the dominant order flow. The highest-probability version of support and resistance trading is always to use the levels to enter in the direction of the larger trend, not to predict reversals.
This connects directly to what we teach in the Trader's Thinktank. Premarket Prep every morning identifies not just the key levels but the directional bias for the session. That context determines whether you're buying support or fading resistance. You need both pieces.
Trading the Zone, Not the Line
Let me bring this back to the practical. If there's one thing I want you to take from this article, it's this:
Stop treating support and resistance like a precise science and start treating it like a probabilistic zone of interest.
You're not going to nail the exact tick every time. Markets are messy. Levels wick through, consolidate, probe. What you're identifying are areas where the odds tilt in your favor, not guarantees.
When price approaches a significant support zone, you're looking for confirmation before you act. Volume, candlestick behavior, momentum shifts. You're not just buying because price touched a line. You're waiting for the market to show you evidence that the level is being respected.
As we break down in our mastering trading discipline article, the discipline to wait for that confirmation is often the difference between consistent results and consistent frustration. It's the part nobody talks about when they teach support and resistance. The level is the easy part. Waiting for the signal at the level is where most traders fall apart.
Rene Santana, one of the traders who went through the Two Hour Trader framework, described his experience with our approach:
"Thanks to the 2-Hour Framework, I currently have 15 withdrawals from Topstep, and I'm funded with 4 accounts. The most impressive part hasn't been the amount withdrawn, it's been the consistency I've been able to build."
Consistency. That's the word. Not the best trade of your life. Not catching every reversal. Consistent application of a framework that makes sense.
Support and resistance is the backbone of that framework. Learn it, respect it, and stop looking for something more complicated.
If you want to see this applied in real time every trading day, with the actual NQ and ES levels plotted before the open and discussed live through the session, that's exactly what we do in the Trader's Thinktank community. It's not a chatroom with people posting memes and alerts. It's a professional environment where traders who take this seriously work on their craft together.
The levels are there every day. The question is whether you're doing the work to find them.