PTG StatMap Tells You What Kind of Day You Are Trading Before the Open
Seven o'clock Central. I am at my desk, NQ chart open, and I have not touched a single level yet.
Before the levels come the questions. What is the intermediate trend doing? What have the last few sessions looked like inside it? What does today's gap tell us about the first hour? What kinds of trades is this tape likely to punish? That read, the backdrop, gets decided before the open. It shapes everything that follows: which setups get attention, which instincts get checked, and which trades get passed on entirely.
For a long time that read lived only in my head. Members in the Thinktank could watch me apply it, hear me explain it, absorb it over months of premarket prep. But the read itself was not formalized anywhere you could look at before you traded.
This summer changed that. I spent several months teaching an indicator to make the backdrop read automatically, then made it prove every number before anything touched a chart. More than 400 sessions of my own hand-marked backdrop calls went in first. Then those calibrated signals got replayed across 11.5 years of NQ data out of sample. Every statistic on the card comes from a pre-registered study. Lines that failed validation were deleted, and there were several. That process produced PTG StatMap.
Here is how to read it.
The State Line
The state line is always present. It prints something like BEARISH 6d / NEUTRAL 2d, which means you are in the sixth session of an intermediate downtrend and the second session of a neutral near-term move inside it. Two clocks, two readings, one line.
When the state flips, the word new appears next to it, and a plain-English translation prints underneath. Something like "bounces are countertrend." That translation exists because knowing a word changed is not the same as knowing what it means for how you trade today.
The state read locks at 7:00 AM Central and holds for the full session. It does not update intraday. Once the card says what kind of day it is, it says that for the rest of the day. This is intentional. The read is a framework for the session, not a ticker that moves with price.
The Headline
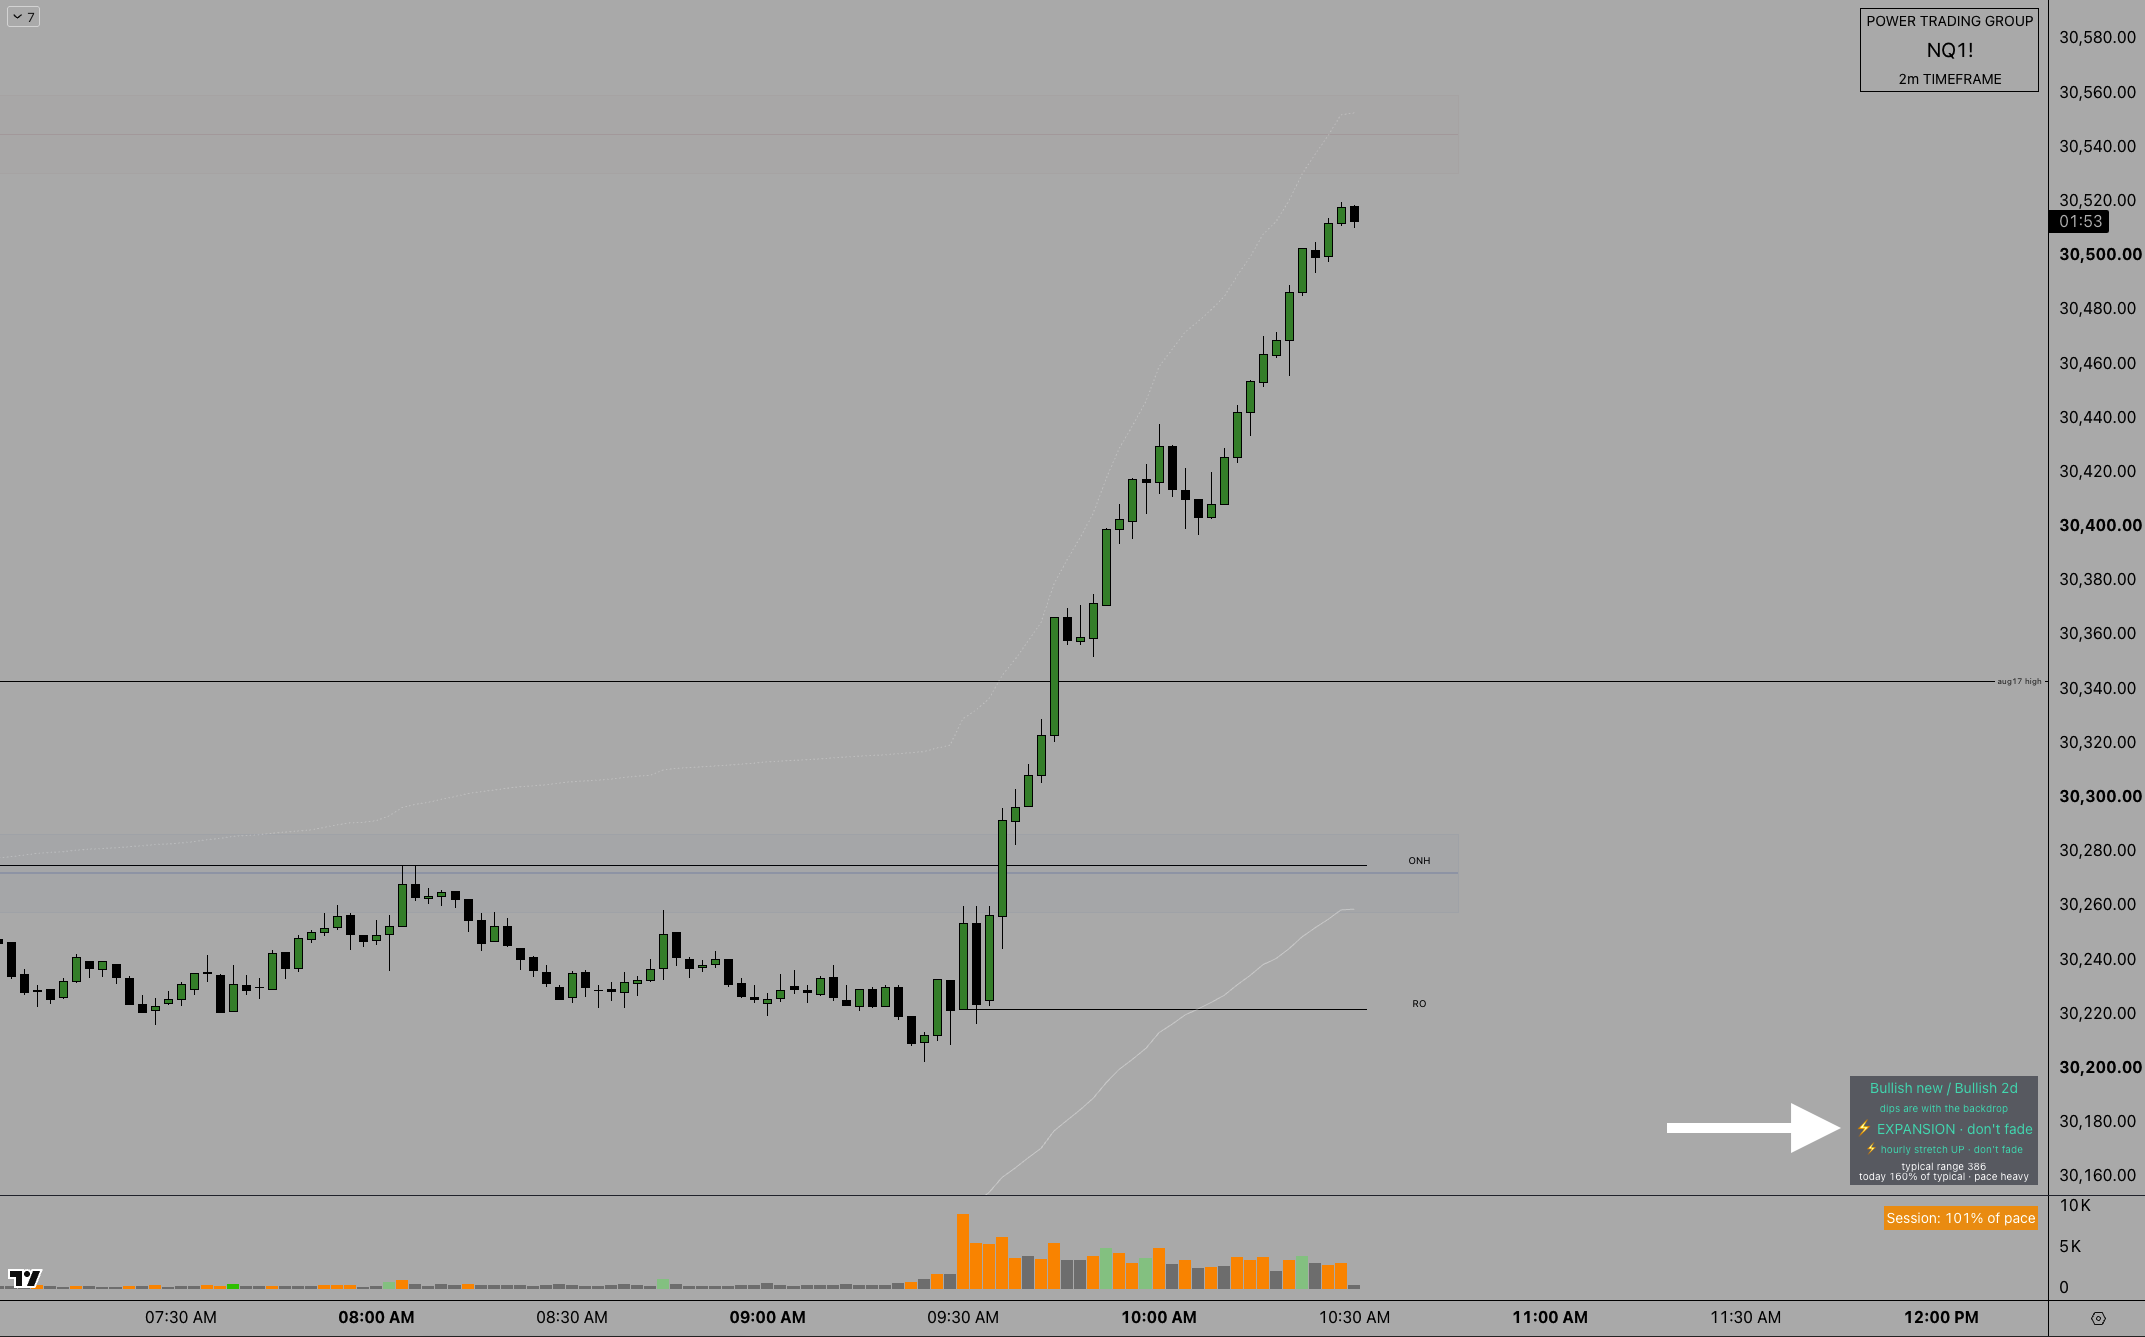
The headline prints only when today has a story worth naming. A gap this size held 72% of the time. Inside day, stays inside 65%. Expansion day, do not fade. Range is set, trade the rotation.
Those percentages are not fixed statistics. They are computed for the specific bucket the day falls into, and they vary. A gap headline reading "holds 72%" means gaps of this particular size, in this directional context, held to the close 72% of the time in the study. It is a conditional probability for today's specific situation, not a general claim about all gaps.
When the headline is dark, that is also information. Nothing statistically unusual is happening. There is no story being forced on the tape, and the card is telling you not to force one either.
The premarket lean line reads something like quiet LIKELY 60% or quiet UNLIKELY 27%. Small days cluster. Big days cluster. This is a sizing and expectation line, not a promise about what will happen.
The Warning Lines
Warning lines are amber. They are rare. When one appears, a trade is being taken away.
The flow veto prints: quick bounce-shorts usually fail here / morning flow: one-sided buying, first 90 minutes. The verdict comes first. The reason underneath it. That trade fails roughly three out of four times in the flagged state.
The stretch veto prints: hourly stretch DOWN, do not fade. Price is in the top decile of stretch from its hourly mean and usually stays extended for hours. Fading this line has failed about 90% of the time.
The combined line handles the cases where those two reads point in opposite directions. On some of the wildest mornings of the year, the morning tape and the hourly trend disagree. When that happens the card prints one picture instead of two arguments: bounce in a downtrend, let it resolve / quick trades usually fail both ways. The mirror case is "pullback in an uptrend."
The instruction is the same either way. Flat: wait, and trade your level after it resolves. Holding with the trend: the bounce is not an exit signal by itself.
Amber always means the same thing on this card. A trade is being removed from the table, or something is wrong with the data. A warning line is not a signal to take the opposite trade. It removes a trade. That is the whole job.
The losers you skip never show up in your journal. Over a quarter they are worth more than most winners. The warning lines exist because the worst trades tend to look the best in the moment. The setup looks clean. The move is happening. Everything in your brain says to press. The card says no. Taking that away quietly, before you ever type in the order, is the point.
The Arming Line
The arming line prints only when the state is one close away from flipping. Something like: 1 more hourly close above 23,412 flips near-term bullish.
The exact price where the machine changes its mind, shown only when it is one close away. This is context for how you hold a position through a potential state change, or how you think about the first trade after the close that triggers it. It is not a signal to buy 23,412. It is information about where the landscape changes.
The Detail Strip
Small text, off by default. When you turn it on in settings, it shows the volatility regime: recent days: quiet, compressing 4d. That tells you the character of the last few sessions, which matters for expectation setting on size and target.
Leave it off if the headline is enough on its own. Turn it on when you want the numbers underneath it.
Tooltips
Every line on the card carries its full explanation on hover on desktop. The definition, the sample behind the number, and what the stat does and does not claim.
This is not a small thing. Numbers under pressure are only useful if you trust them. You will only trust a number at 9:45 AM when you are in a trade that is going against you if you already know where that number came from. The tooltip is there so that trust is built before you need it.
When the Card Warns About Itself
Amber checks lines mean the data feed is not giving the machine what it needs. A red DO NOT TRUST line means exactly that. The card fails loudly rather than quietly showing you something wrong.
The flow warnings specifically need about two weeks of one-minute history and real-time CME data. On delayed data the vetoes arrive late. On a freshly loaded chart the line stays quiet until it has enough history to work. This is not a bug. It is the card declining to show you a number it cannot yet validate.
Running It
StatMap requires NQ or MNQ futures on a chart that includes overnight data, meaning the regular extended-hours session needs to be visible. Any intraday timeframe works.
It pairs with PTG Levels of Interest. The Levels indicator is the where: the areas I mark in premarket prep, auto-plotted and locked each morning. StatMap is the what kind of day: the backdrop those levels get traded against. The two answer different questions, and together they give you what you need before the open.
Contract rolls happen four times a year, in March, June, September, and December. Three approaches:
Switch to the front contract by hand. This is the cleanest method. The card recomputes from the new contract's own history after you switch symbols. Recreate your alerts, because alerts stay tied to the old symbol.
Continuous back-adjusted chart. Also clean. Levels, gaps, and ranges all read true on a properly back-adjusted feed.
Continuous unadjusted chart. This is the one to watch. The old and new contracts trade a few hundred points apart, and the splice puts that difference on your chart as a jump that never actually traded. During roll week, treat gap headlines and fresh state flips with suspicion if you are on an unadjusted continuous chart, or switch chart types for that week.
The card cannot detect rolls on a continuous chart. It will not warn you. You need to know which chart type you are running.
What StatMap Will Never Do
It does not call entries, exits, targets, or stops. It never calls a trade.
It does not predict reversals. It does not have a win rate, a P&L, a profit factor, or a backtest return. There is no performance claim for StatMap because it is not that kind of tool. It is a backdrop indicator.
It does not update the state read intraday. Once locked at 7:00 AM Central, it holds.
It works only on NQ and MNQ. Not ES, not YM, not any equity.
It does not replace your plan. It does not replace Levels of Interest. It does not make the trade for you.
The analysis and the execution are two entirely different things. Identifying the correct read does not mean the right entry appears. StatMap gives you the read. The entry is still yours.
The Backdrop and the Work
That is the honest framing for what this indicator does. It gives you the backdrop before the open, the same backdrop I have been building into every premarket prep for years, now formalized and validated against more than a decade of data. It takes the worst trades off the table by naming the conditions under which those trades tend to fail.
The trade is still yours. The level is still yours. The discipline to wait for location, to sit through the arming line without forcing the flip, to see an amber warning and close the order ticket is still yours.
That is exactly what we work on in the Thinktank every day.
StatMap access is included with Trader's Thinktank membership. The script is invite-only on TradingView. Once you join, comment your TradingView username in the community and you will be granted access. You can also view the script page here while you wait.
The premarket prep starts at 8:45 AM Eastern. By then, the backdrop is already set.