VPOC Trading Strategy: How to Use the Volume Point of Control
Most traders stare at a chart full of candles and see price. What they miss is the story underneath: where volume actually concentrated, where real money changed hands, and where the market is likely to return.
That's what the Volume Point of Control tells you.
VPOC is one of the most actionable concepts in volume profile analysis, and yet it's consistently misunderstood or flat-out ignored by retail traders. They're too busy chasing breakouts or drawing trend lines to notice that the market keeps gravitating back to specific price levels like a magnet. Understanding VPOC and building it into a real strategy changes how you see every session.
Let me break down exactly what VPOC is, why it matters, how to trade it, and how to combine it with the broader volume profile for high-probability setups.
What Is the Volume Point of Control (VPOC)?
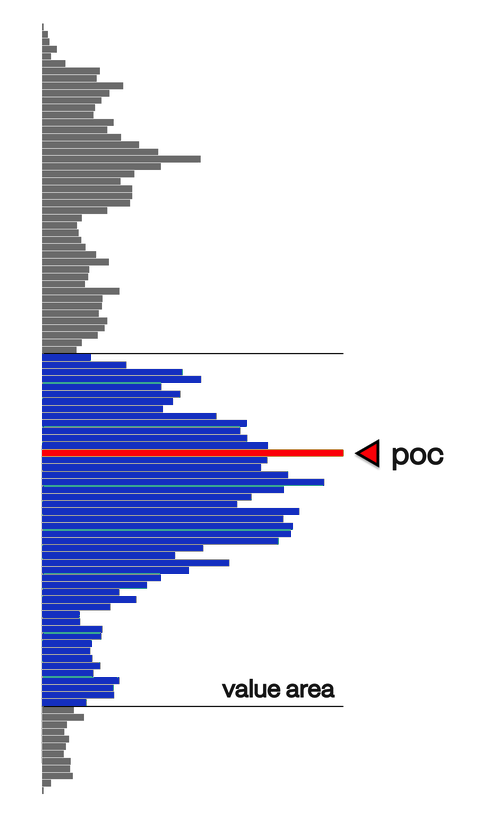
The Volume Point of Control is the price level where the most volume traded during a given period. That's it. One price, the highest volume node on the distribution.
But simple doesn't mean trivial.
When you think about what volume represents, it clicks. Volume is participation. It's the aggregate of every buy and sell that executed at a price. The VPOC is where the most buying and selling happened. That means it's where the most market participants agreed on value, at least temporarily.
Markets have memory. Price tends to return to where business was done. That's not a mystical concept, it's the basic mechanics of how market structure forms.
Session VPOC vs. Developing VPOC
There are two versions worth knowing:
Session VPOC is fixed at the end of the trading day. It shows you where the highest volume occurred during that completed session. This becomes a reference level for future sessions.
Developing VPOC shifts in real time as volume accumulates throughout the day. Watching it migrate tells you where the market is finding value as the session unfolds.
Both are useful. The session VPOC gives you clean, confirmed levels to work from. The developing VPOC helps you read intraday flow as it's happening.
Why VPOC Matters More Than Most Support and Resistance
Traditional support and resistance is drawn from price action: prior highs, prior lows, consolidation zones. That's valuable, but it's incomplete. It tells you where price has been, not necessarily where participants placed significant value.
VPOC is different because it's anchored to volume. It tells you where the majority of contracts changed hands. That's a much stronger magnet.
Here's a scenario you've probably seen a hundred times without realizing what it was. Price rallies away from a level, pulls back, and seems to stall in what looks like empty air on the chart. No obvious candle-based support. But it holds. Why? Often because you're sitting right on a prior session's VPOC. That's where participants previously agreed on value, and the market is testing whether that consensus still holds.
When it holds, price typically bounces with conviction. When it breaks, it's meaningful, because real value area support just gave way.
How to Trade VPOC: Three Core Setups
1. VPOC as a Magnet (Mean Reversion)
This is the most reliable VPOC application. When price moves away from the VPOC, especially quickly, it has a statistical tendency to return and test it.
Think of it like a rubber band. Price stretches away from value, and the market snaps it back.
The setup:
Price opens away from prior session VPOC
Initial move is directional and fast (low volume, no real acceptance)
Price stalls and begins to drift back toward VPOC
Enter in the direction of the reversion as price approaches VPOC from above or below
Target: VPOC tag or slight overshoot
This isn't about predicting every reversal. It's about recognizing that unconfirmed moves away from high-volume areas frequently get retraced before the market decides whether to accept new prices.
2. VPOC as Support or Resistance (Bounce Plays)
Once price reaches the VPOC, two things can happen: it holds and bounces, or it breaks and the level gets retested as opposite-side resistance or support.
The bounce trade:
Prior session VPOC sits below current price
Price pulls back and approaches that VPOC
Volume contracts on the approach (sellers losing conviction)
A rejection candle or absorption pattern forms at VPOC
Enter long with stop below VPOC by a few ticks
The break-and-retest trade:
Price slices through VPOC with volume
A quick pop back to VPOC from the other side
The level now acts as resistance
Short the retest with tight stop above VPOC
The key to both is reading the price action at the level, not just placing a limit order and hoping. VPOC tells you WHERE. Price action at that level tells you WHETHER.
3. VPOC Confluence (Highest-Probability Entries)
VPOC in isolation is useful. VPOC aligned with other factors is where the real edge lives.
When a VPOC coincides with a structural level from a market structure analysis, the probability of a meaningful reaction jumps significantly. Same when it aligns with a trend line, a key moving average, or a prior swing high or low.
I've seen sessions where the prior VPOC sits exactly at a weekly demand zone. Those are the levels I circle in advance and watch closely. When price gets there, I'm patient and precise. The setup doesn't need to be forced.
In the Trader's Thinktank, we mark these confluence levels during morning prep every day. It's one of the first things on the daily plan: where are the VPOCs from recent sessions, and do any of them line up with structural significance? That alignment dictates trade priority for the session.
Combining VPOC with the Full Volume Profile
VPOC is one data point within the volume profile. To use it well, you need to understand the context it sits in.
The volume profile shows you the full distribution of volume across a price range. That distribution has three key zones:
Value Area High (VAH): Upper boundary where approximately 70% of volume traded
Value Area Low (VAL): Lower boundary of that same 70%
VPOC: The peak, where volume was highest within the distribution
Price tends to spend most of its time oscillating within the value area. When it breaks outside the VAH or VAL, you get one of two outcomes: either it's rejected and returns (fading the extension), or the market accepts the new prices and the value area shifts.
For a deeper breakdown of how the full volume profile works and how to read volume distributions across sessions, the guide on mastering volume profiles covers the complete framework.
Knowing how VPOC fits within the value area changes how you trade it:
A VPOC near the center of a balanced distribution suggests equilibrium. Price is likely to continue chopping within that range.
A VPOC shifted toward the high or low of the distribution (called a skewed profile) suggests directional intent. Price is migrating toward new value.
When the current VPOC aligns with a prior session's value area boundary, you have stacked confluence.
The traders who struggle with volume profile use VPOC like a magic line. The traders who make money with it understand it as one piece of a distributional story about where value is and where it's migrating.
Common VPOC Mistakes
Treating VPOC as a precise entry trigger. VPOC is a zone of interest, not a tick-level entry signal. Price rarely turns on a dime exactly at the VPOC. Give it a few ticks of wiggle room and look for confirmation.
Using only the current session VPOC. Prior session VPOCs, multi-day VPOCs, and composite VPOCs from longer timeframes all carry relevance. Don't ignore the structural memory of the market.
Ignoring the shape of the volume profile. A VPOC in a thin, elongated profile behaves differently than one in a wide, balanced distribution. Context always matters.
Overtrading the magnet concept. Yes, price tends to revisit VPOC. But sometimes it doesn't. If price is in a strong trend with real acceptance, fighting it back toward an old VPOC is a losing battle. Read the broader context before fading every extension.
"Unlike other groups focused on signals or watchlists, here you will learn to trade the market. To find your own identity as a trader." - Martin Chavez
Setting Up VPOC on Your Charts
If you're on TradingView, the volume profile tools are available in the paid tiers. The fixed range and visible range volume profiles both show VPOC. The VPOC is typically displayed as a line at the highest volume node within the selected range.
A few setup recommendations:
Mark prior session VPOCs manually or use a script that plots them automatically
Display at least the past 5 to 10 session VPOCs on your intraday chart
Note when multiple session VPOCs cluster near the same price (high-confluence area)
Add the developing VPOC to your primary timeframe during the session
You don't need to clutter the chart. A clean display of recent VPOCs alongside the current session's value area gives you a clear roadmap without noise.
Putting It Together
VPOC trading isn't complicated, but it does require a shift in how you think about price. Price is not just a line moving through time. It's a reflection of participant behavior, and volume tells you where that behavior concentrated.
When you start seeing the VPOC not as an indicator but as a map of where real money agreed on value, the trades become clearer. You stop guessing and start observing.
If you want to develop this kind of read on the market in real time, with live session analysis and daily VPOC levels every morning before the open, that's exactly what we do every day in our Trader's Thinktank community. Every session starts with a prepared plan, including the key volume levels that matter for the day.
For a broader foundation in reading the market through price action and structure, the guide on how to read price action and the Wyckoff method breakdown both complement the volume work directly.
"I learned more from Kyle in one hour than I have from hours and hours of Youtube, reading articles, and taking courses from other groups." - Mike
The market leaves footprints. VPOC is one of the clearest ones. Learn to read it, and a lot of what previously looked random starts to make sense.