
Rich’s APT Results: $12,436 in Three Months on Default Settings
Most trading case studies are highlight reels. Best month, best trade, best conditions. You rarely see the full picture: what the drawdowns looked like, whether the edge held across different market environments, how the system actually behaved when things got choppy.
Rich's results are different. Three months. Default settings. No optimization, no custom tuning, no hand-holding after setup. Just APT running the way it was designed, month after month, on a Tradovate demo account.
The headline number is about $12,436 net across April through June 17, 2026. But the number I keep coming back to is not the total. It is the expectancy trend: $81.52 per trade in April, $84.96 in May, $102.90 in the partial June. The per-trade edge is not decaying. It is growing. That is the story worth telling.
The Setup
Rich shared his results directly, and I will let him describe it in his own words:
"18 MNQ and MYM based on NQ/YM, both directions, April through yesterday $12K in the Live Demo Tradovate (nonprop). Always on the default time for APT. April was when I set this up."
So to be clear about what we are looking at: Rich is running APT on micro contracts, specifically MNQ (Micro Nasdaq-100) and MYM (Micro Dow Jones), taking signals in both directions. He set everything up in April 2026 and has not changed the timing settings once. Out of the box.
One note on context: Rich is running this in a live Tradovate demo account, not a funded prop account, as a structured test before scaling to live capital.
What stands out across 157 trades and three calendar months is the consistency of the edge. That is a real signal.
He also built in two hard risk guardrails himself: a daily loss limit of $3,500 and a weekly loss limit of $7,000. These are not APT defaults. These are decisions Rich made about his own risk tolerance, then baked into the system so they enforce themselves. That discipline layer matters. We will come back to it.
The Numbers, Month by Month
All figures come from Rich's Tradovate performance dashboards.
April 2026
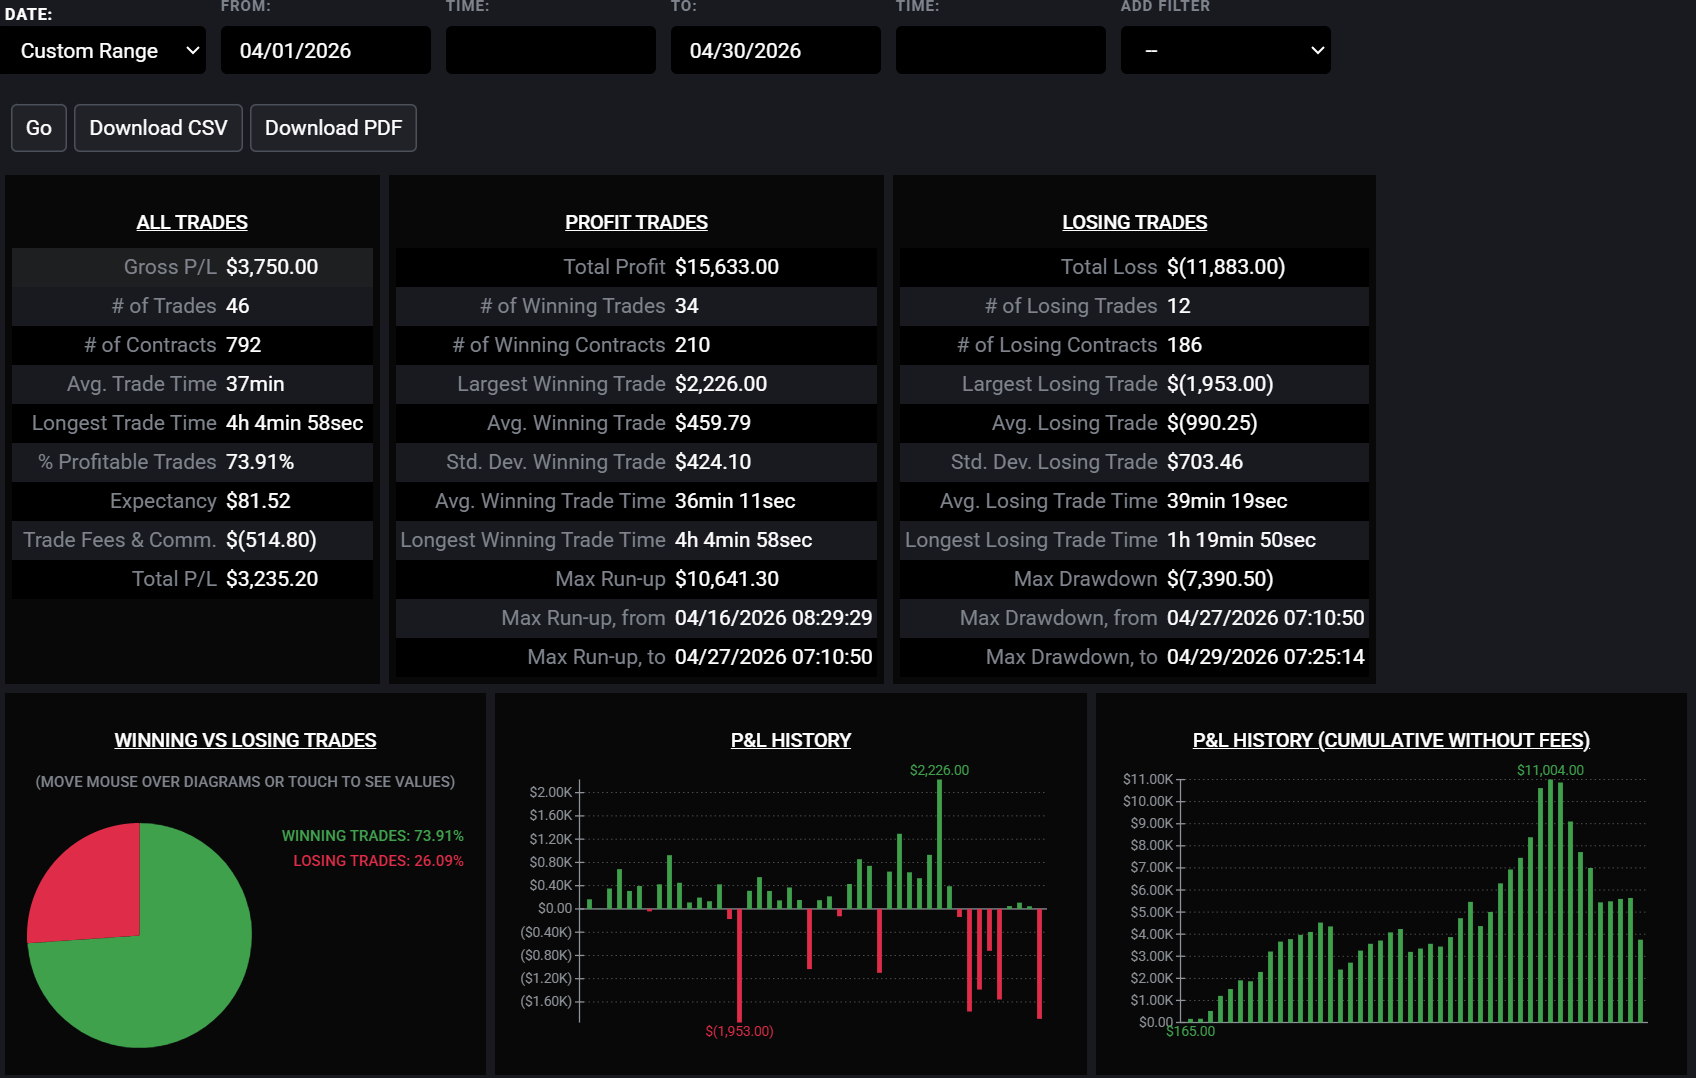
Rich set APT up in April and ran a full calendar month straight out of configuration.
Net P/L after fees: $3,235.20
Gross P/L: $3,750.00
Fees and commissions: $514.80
Trades: 46 total, 34 wins, 12 losses
Win rate: 73.91%
Contracts traded: 792 micro contracts
Expectancy: $81.52 per trade
A 74% win rate in month one of running a brand-new system, with no adjustments. That is not beginner's luck. That is the underlying edge showing up right away. The fees are real, too. $514.80 across 46 trades averages about $11 per trade in round-trip commissions, which is exactly what you should expect at micro-contract size.
May 2026
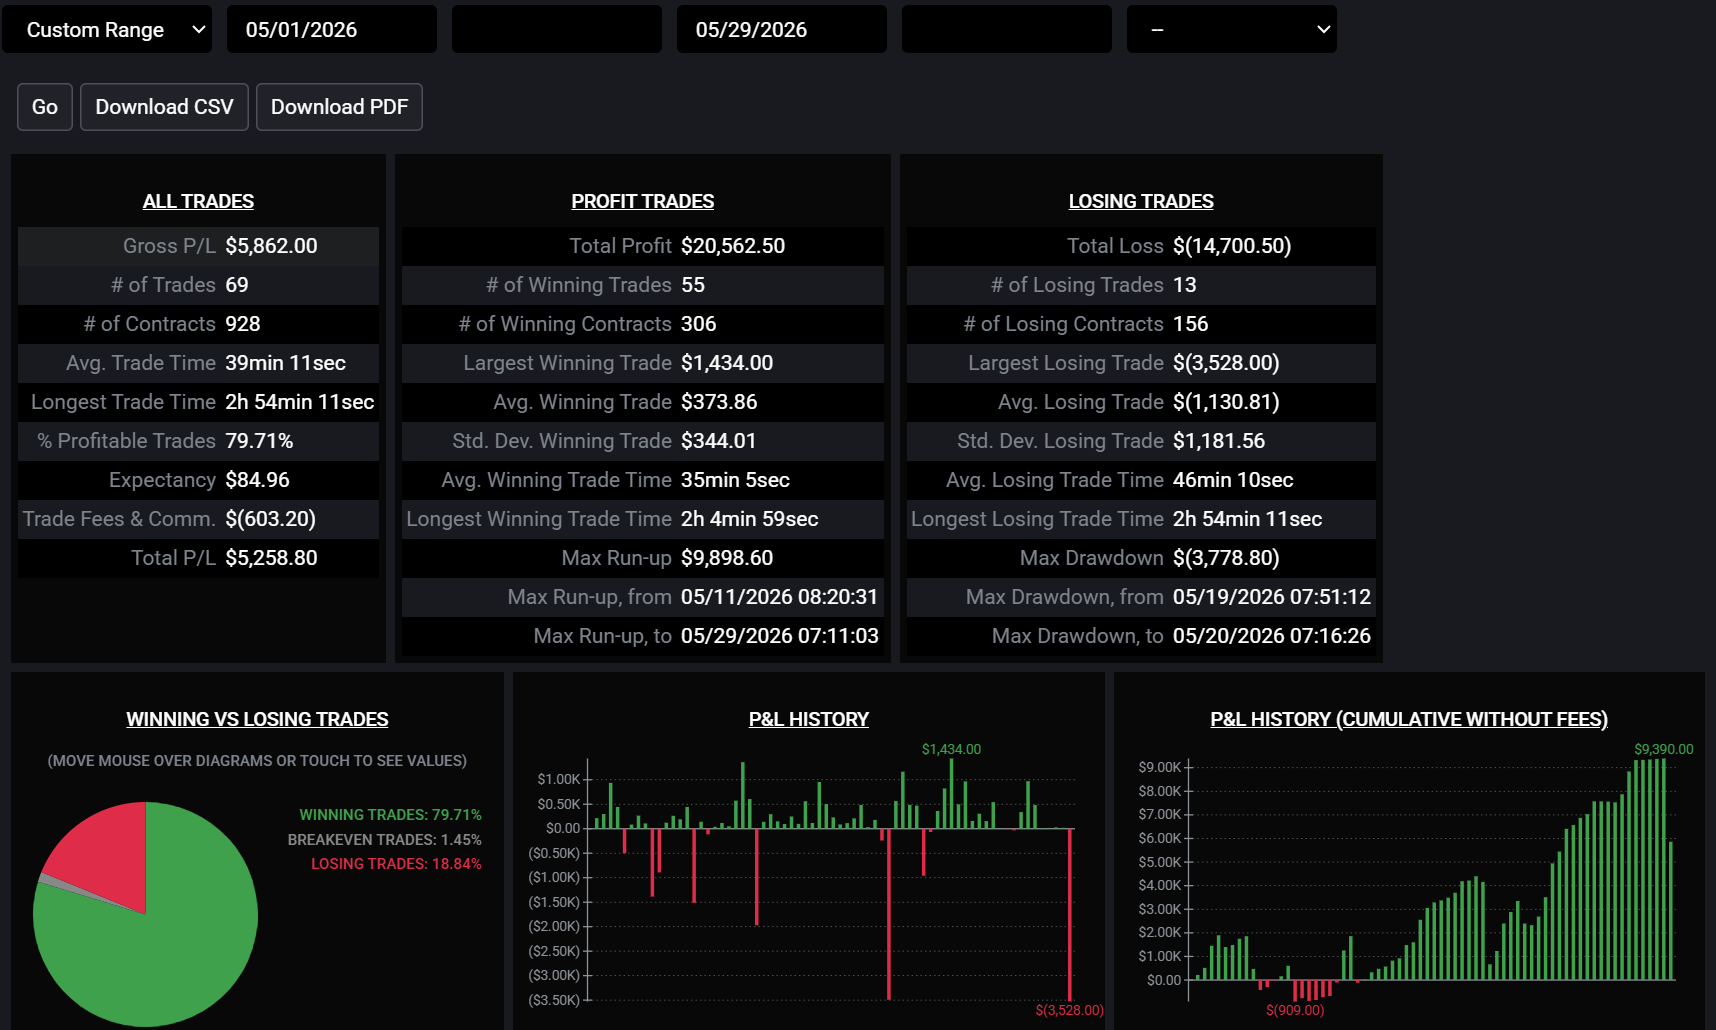
May was APT's best month in Rich's account. Volume went up, win rate went up, expectancy went up.
Net P/L after fees: $5,258.80
Gross P/L: $5,862.00
Fees and commissions: $603.20
Trades: 69 total, 55 wins, 14 losses
Win rate: 79.71%
Contracts traded: 928 micro contracts
Expectancy: $84.96 per trade
The win rate jumping to nearly 80% in month two is notable. May's market had some sharp, volatile intraday stretches. The system ran untouched through all of it. No intervention. No second-guessing. The AutoPilot Trader simply executed its logic and closed out the month green.
June 2026 (Partial: June 1 Through June 17)
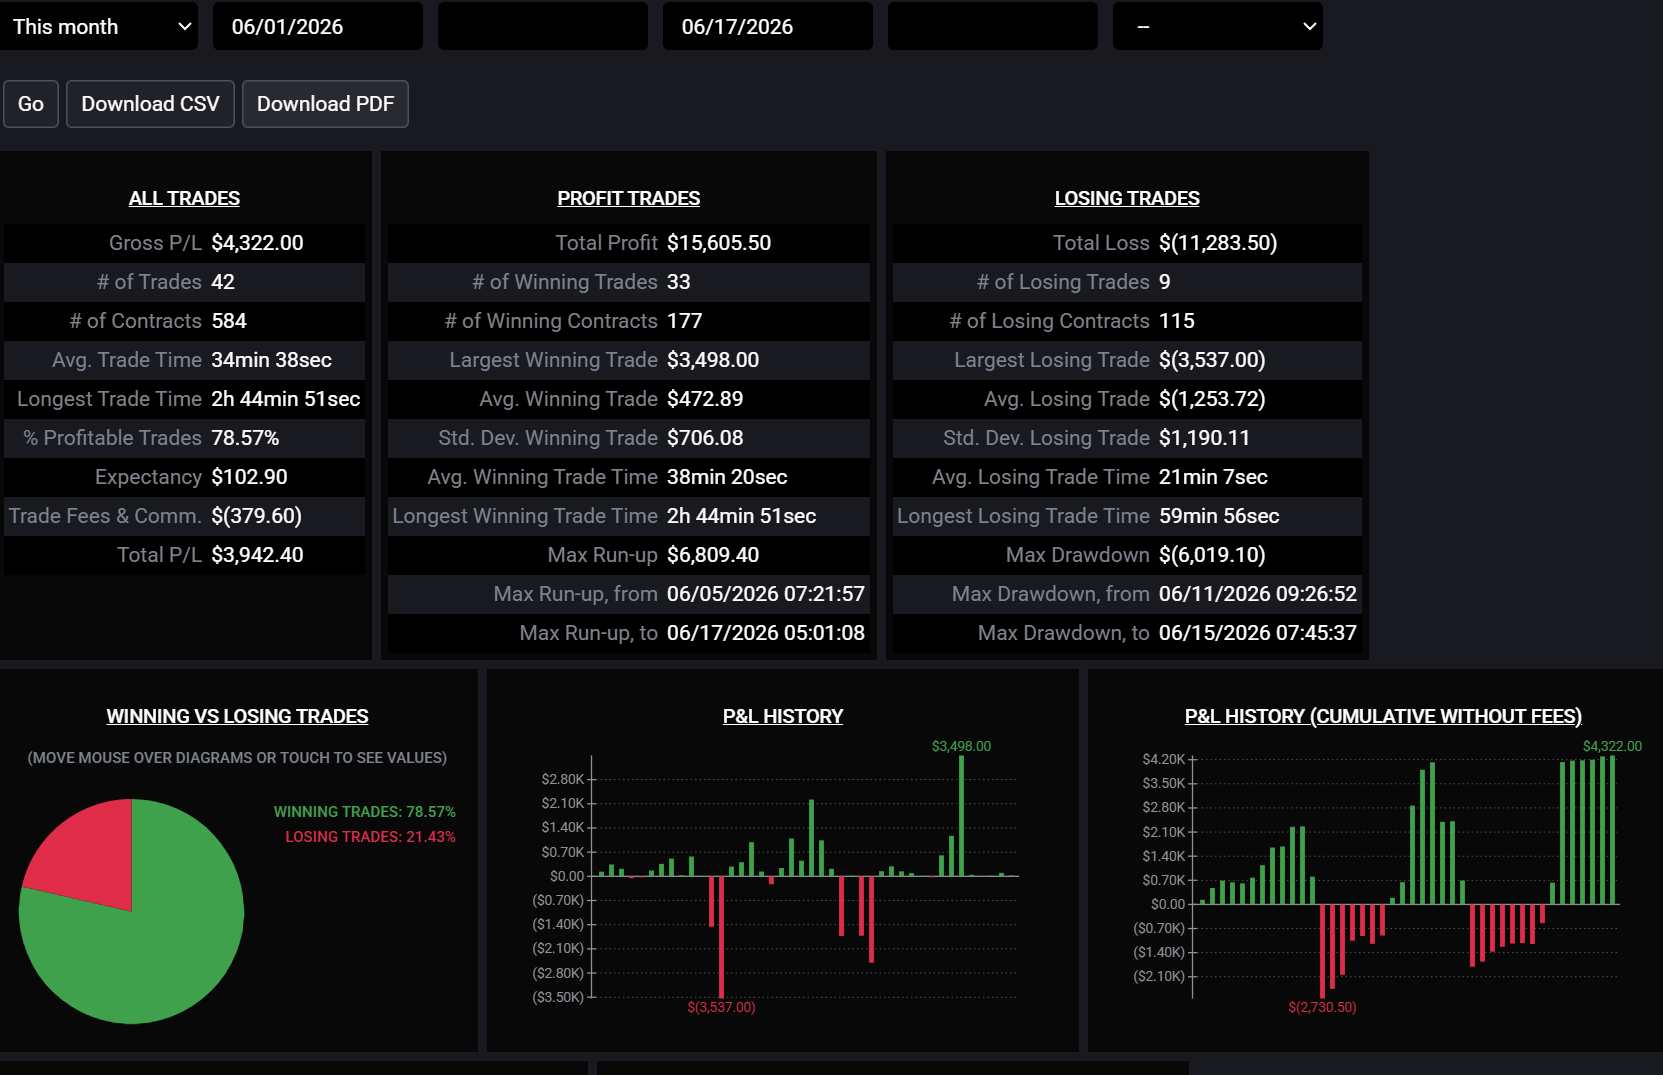
Partial month, still in progress when Rich shared his results. Already outpacing April's full-month expectancy.
Net P/L after fees: $3,942.40
Gross P/L: $4,322.00
Fees and commissions: $379.60
Trades: 42 total, 33 wins, 9 losses
Win rate: 78.57%
Contracts traded: 584 micro contracts
Expectancy: $102.90 per trade
Fifteen trading days in June produced $3,942 net. The largest single winning trade in Rich's data came in June, around $3,498. The expectancy clearing $100 per trade is the clearest signal yet that the edge has not deteriorated from use. If anything, the three months of data suggest the system finds its rhythm.
Combined: April Through June 17
Net P/L: approximately $12,436
Total trades: 157
Total winners: 122
Blended win rate: approximately 78%
Micro contracts traded: approximately 2,304
Why the Expectancy Trend Matters More Than the Total
Here is what I want people to actually sit with: $81.52, $84.96, $102.90.
When a trading edge degrades, you see it first in expectancy. Win rate might hold for a while on statistical noise, but the average profit per trade starts shrinking as market conditions shift away from whatever conditions the system was optimized for. That is the curve-fitting problem. That is why most backtests do not survive live trading.
Rich's expectancy went the other direction. Three months in, the system is extracting more value per trade than it did on day one. There is no cherry-picked window here. There is no "we only showed you the good stretch." The data runs from April 1 through mid-June, through the kind of mid-year chop that kills most manual discretionary approaches.
The edge is real. It is durable. And Rich found this out by doing nothing except letting the system run.
In our Trader's Thinktank community, we talk about this constantly: the hardest thing in systematic trading is not finding the edge. It is trusting it long enough to let the edge show itself. Most traders blow up a good system by intervening too early, adjusting after two bad trades, or second-guessing entries that do not look "right" in the moment. Rich did not do any of that. He set it up, set his risk limits, and stepped back.
Consistency compounds. In Rich's case, it compounded to $12K across three months without a single discretionary override.
What Default Settings Actually Means
I want to be direct about this because it matters for how you interpret Rich's results.
Rich did not run a custom-optimized version of APT. He did not spend a month tweaking parameters, adjusting timing windows, or dialing in filters for his specific market environment. He ran the default configuration. The timing settings are exactly what every new APT user gets when they complete the setup call.
This is significant for two reasons.
First, it means these results are replicable. Rich is not a systems expert who happened to optimize the settings perfectly. He followed the setup process, used the defaults, and let it run. Any APT user running the same configuration on the same instrument pair with the same sizing would have seen comparable logic executing in their account.
Second, it validates that the out-of-the-box configuration is built to perform. The defaults are not a starting point meant to be improved before you see results. They are the result of Kyle's decade-plus of trading the Two Hour Trader framework, distilled into settings that do not require the user to have that experience themselves.
The Two Hour Trader strategy is what APT automates. The same entry logic, the same profit targets, the same stop management. Rich is benefiting from a framework that has been traded and refined for years. He just removed himself as the execution variable.
The Discipline Layer Rich Built
Hard daily loss limit: $3,500. Hard weekly loss limit: $7,000.
Rich configured these himself, based on his own account size and risk tolerance. They are not APT defaults. They are a second layer of protection that Rich decided he wanted, built into the system so they enforce automatically.
This is exactly the kind of decision that separates traders who build consistent accounts from traders who blow up systematic approaches. A good system can still be destroyed by a single week of outsized drawdown if there is no circuit breaker. Rich built one.
I have watched traders in our community run great strategies into the ground because they did not have the discipline to stop trading after a bad run. The weekly loss limit is mechanical discipline. It does not care how you feel about the market on Friday afternoon. It just stops the system.
What Rich built is the same framework I talk about in the Thinktank regularly: define your risk parameters before you trade, then let the system enforce them. Do not rely on willpower in the moment. Bake the guardrails in.
Rich has clear rules of engagement, and they show up in his results.
What Systematic Execution Removes
Let me be honest about what Rich's three months represent at the behavioral level.
Every trade APT took in Rich's account was rules-based. There was no hesitation on entries because price "looked extended." There was no early exit because a position was uncomfortable. There was no skipping signals after two consecutive losses. The system executed 157 trades across three months with zero emotional variance.
Manual traders reading this will recognize every one of those failure modes because they have all lived them. The hesitation. The early exit. The skip after a losing streak. Each one costs money, and none of them show up in a backtest. They only show up in the gap between your backtest results and your live trading results.
APT eliminates that gap. Not by being smarter than a skilled discretionary trader, but by being completely consistent in a way that no human trading under real-money conditions can sustain across hundreds of trades.
Rich's $12,436 is not just a P/L number. It is what the edge looks like when it is executed correctly 157 times in a row.
What This Profile Tells You
Rich is not a professional trader. He did not have a custom configuration built for his account. He did not have a team optimizing his settings each week. He ran APT on defaults, set his own risk limits, and left it alone.
Three green months. Rising expectancy. 78% blended win rate across 157 trades.
If you have been skeptical about whether a systematic approach can actually deliver what we say it delivers, Rich's data is about as transparent as it gets. Month-by-month figures, full trade counts, gross and net separated, fees included. No headline number without the full context behind it.
If you want to understand the full architecture of how APT works, including the V3.3 improvements to risk pricing across all eight supported contracts, the details are at powertrading.group/autopilot-trader.
And if you want to see APT's signals in action before committing to automation, every Trader's Thinktank membership includes APT Signals, the manual indicator that plots the same entry, stop, and profit-target levels the automation executes. It is the closest thing to a live preview of the system without turning on full automation.
Rich's three months are on file. The methodology behind them is documented. The edge is repeatable.
What you do with that information is up to you.