
There's a moment that happens to almost every developing trader. They pull up a chart, identify what looks like a clear series of higher highs and higher lows, call it bullish structure, and buy. Then price reverses immediately and takes out their stop.
So they go back to the textbook. Read more about market structure. Watch more videos. And they still keep getting chopped up.
Here's the problem: most market structure education teaches you what price has done. Not what it's doing, or where it's doing it. That distinction sounds subtle. It isn't.
The Definition Is Correct. The Application Is Wrong.
Ask anyone to define market structure and they'll give you a reasonable answer. Swing highs and swing lows. Higher highs and higher lows for an uptrend. Lower highs and lower lows for a downtrend. Ranging when price oscillates between a ceiling and a floor.
That's accurate. And it's almost useless on its own.
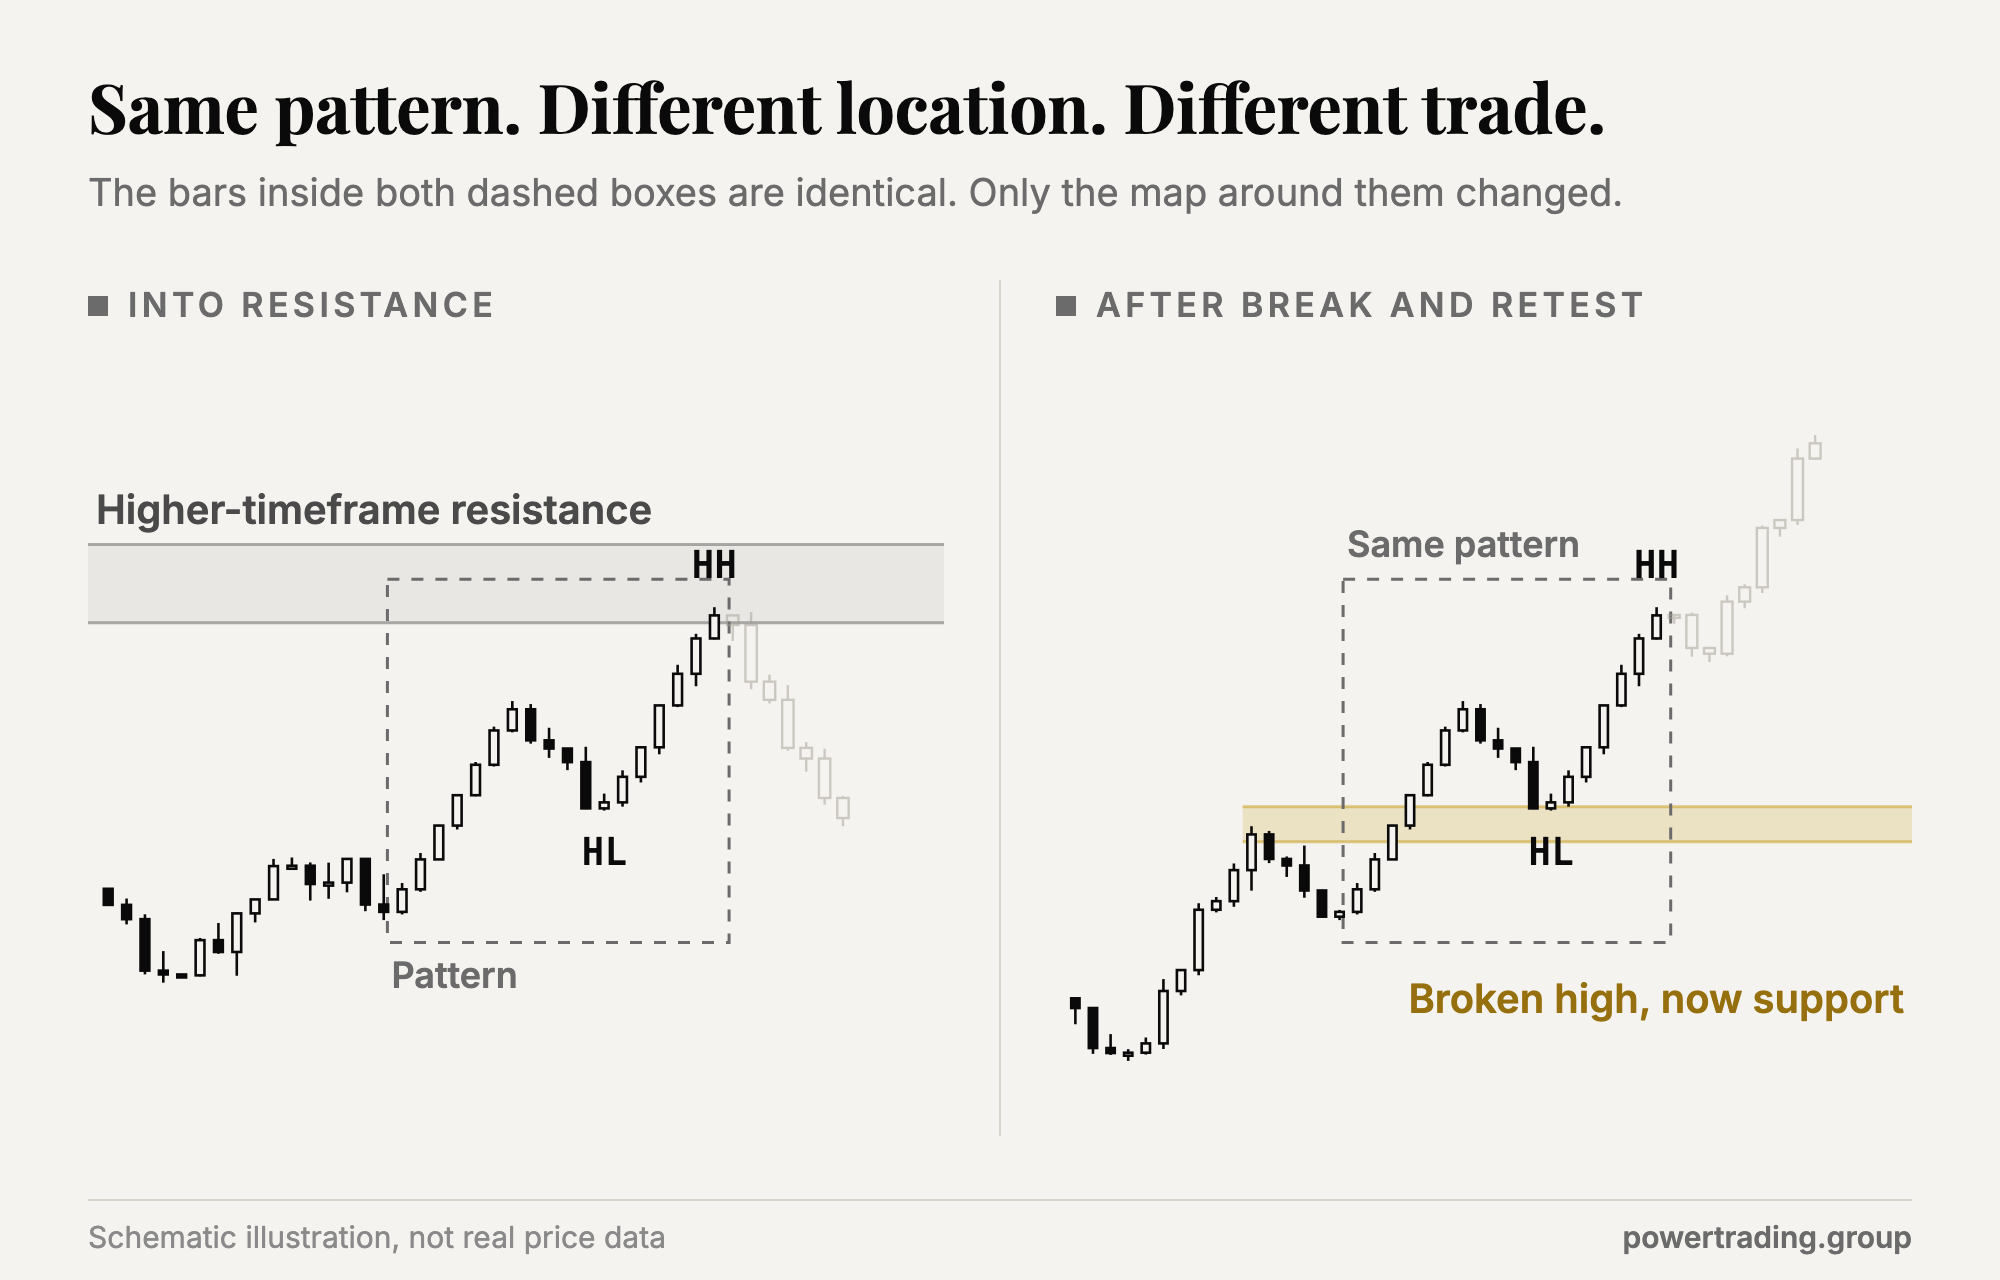
What the textbook version leaves out is location. Two traders can look at the exact same bullish structure and have completely different odds of success depending on where that structure is forming relative to higher timeframe levels, prior swing points, and the broader contextual map.
Bullish structure forming right into a major resistance area is not the same trade as bullish structure forming after a clean break and retest of support. The pattern looks identical. The location is everything.
This is where the Wyckoff framework starts to matter, because Wyckoff didn't just teach you to identify structure. He taught you to read what the structure reveals about supply, demand, and the intentions of large participants. The Wyckoff method reframes market structure from a labeling exercise into a story about who controls price at any given moment.
What Market Structure Trading Actually Requires
I want to give you a real example from the stream on August 26th.
NQ drifted lower through a slow morning on below-average volume, and the one setup in my playbook that triggered was an intraday spring at the session low. Visually it looked right, the kind of thing you see in highlight reels and case studies.
I passed on it.
Not because I lacked confidence. Because price hadn't swept the prior day low first, which was my required location criterion. That prior day low was sitting just below, and without that sweep, the spring setup was incomplete relative to my system. The context wasn't right even though the pattern was.
"Only entry within my system would be uh intraday spring down here. But I mean, we were looking at that live, but I want a prior day low. I want a prior day low."
That was almost certainly the only qualifying entry of the session. I finished the day in cash.
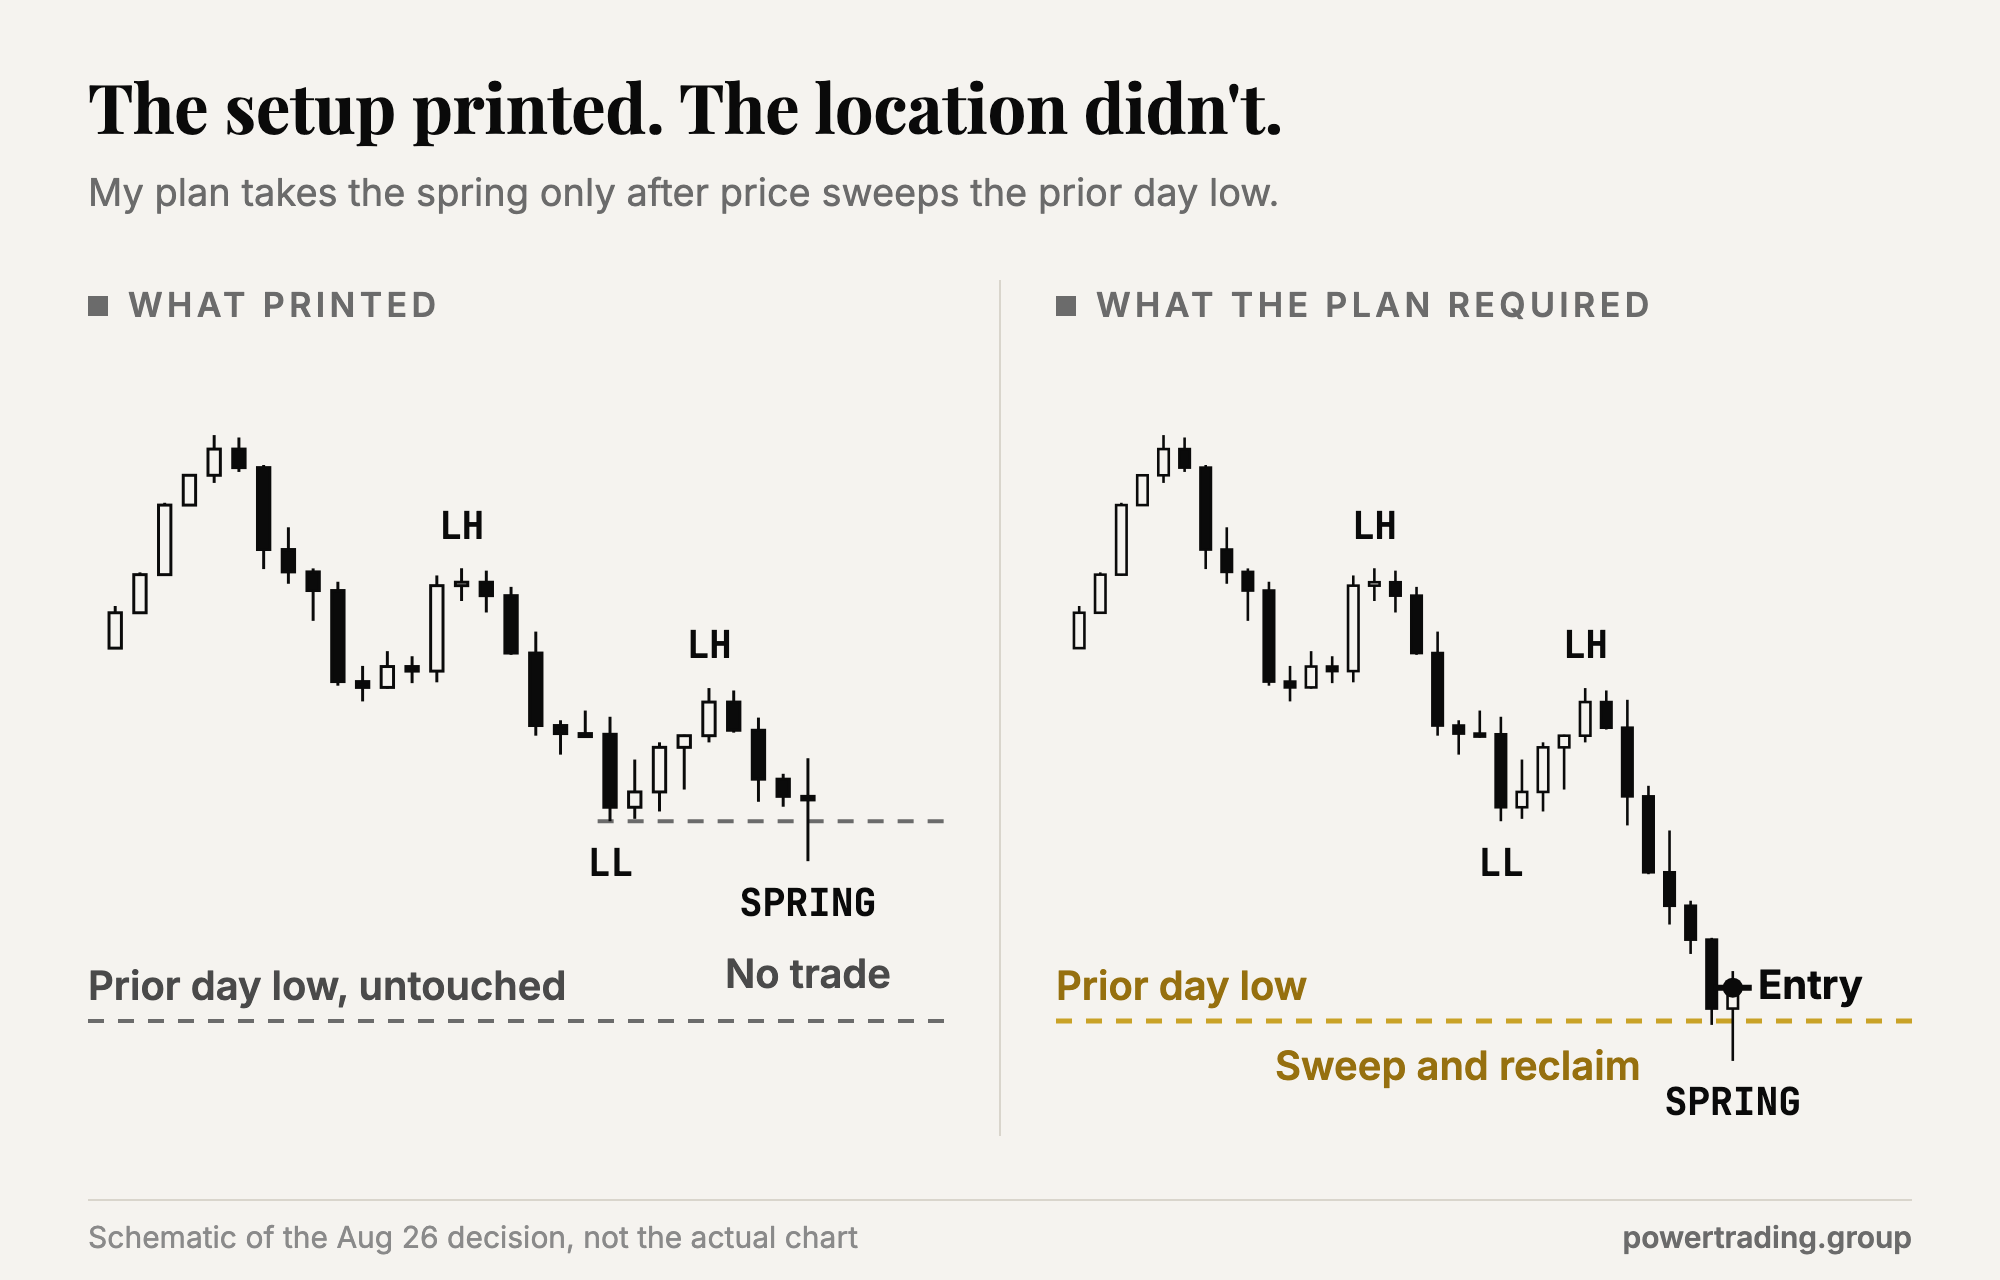
To a trader focused purely on the visual pattern, passing that trade looks like a failure of nerve. But market structure trading at the level that produces consistent results isn't about reading the pattern. It's about reading the pattern in the right place. The prior day low was a structural reference point. Until price interacted with it, the location condition wasn't met, and without location, the setup doesn't have the same odds.
That's the real discipline in this approach. Not just recognizing structure, but knowing when the structure you're seeing is actually in a meaningful position on the map.
Three Structural Conditions That Actually Matter
Here's a framework I use when evaluating whether market structure is giving me useful information or just noise.
Is the structure respecting or violating higher timeframe reference points?
Higher highs and higher lows on a 5-minute chart mean very little if they're forming directly underneath a prior week's swing high or a major resistance area on the daily. Structure that's bullish on a lower timeframe and bearish on a higher timeframe creates conflict. Conflict is where traders get trapped.
Before you label the intraday structure, pull back and understand where intraday price is relative to the larger picture. The comprehensive guide to market structure we've published goes deeper on this multi-timeframe alignment concept, and it's worth reading before you ever try to trade purely from a single chart.
Is the structure producing quality swing points or messy ones?
Clean, decisive swings with clear directional intent tell a different story than a series of choppy, overlapping bars that technically qualify as higher highs. Market structure reads well when the swing points are crisp because that usually indicates participation from larger players who have genuine directional interest. When every swing looks like a grind, the market is often in a search phase, distributing, or simply waiting for a catalyst.
Trading structural patterns in a grinding, overlapping range is one of the fastest ways to erode an account. The pattern technically exists. But the underlying conditions that make it work are absent.
Is the most recent structural shift confirmed or just forming?
A break of a prior swing high on one candle's close is not the same as a sustained break with follow-through and a successful retest. This is where a lot of newer traders get burned. They see what looks like a break of structure, enter immediately, and then watch price reclaim the level and continue in the original direction.
In practice, I want to see the break, then the pullback to test the broken level, and then continuation. That sequence gives me both confirmation and a logical entry location. Entering on the initial break is trading anticipation. Waiting for the test is trading confirmation with the structure on your side.
The Part Nobody Puts in the PDF
Market structure education tends to present price as clean. As if the market regularly forms textbook higher highs and lower lows with obvious swing points anyone can identify.
The real market spends a significant amount of time in ambiguous conditions. Ranges that go slightly beyond their prior boundaries. Swings that almost qualify. Days where the structure is genuinely contested and the right answer is no position at all.
This is the part that doesn't show up in the PDF courses or the Twitter screenshots. Professional traders regularly look at charts and conclude that the structural picture is unclear, and therefore they have no edge in that session. In our Trader's Thinktank community, we spend a lot of time on this exact skill, the ability to identify when structure is readable versus when it's noise, because that distinction is worth more than any particular entry pattern.
Martin Chavez, a member of the community, described it this way:
"Unlike other groups focused on signals or watchlists, here you will learn to trade the market. To find your own identity as a trader."
Learning to trade the market starts with reading conditions accurately before committing capital. Market structure is a conditions-reading skill before it's an entry skill.
Where This Connects to Risk Management
I want to come back to the spring setup I passed on, because there's another layer to it.
Even if I had taken that trade and been right, the absence of the prior day low sweep meant one of my structural anchors for placing a stop was absent. Entering without that reference point means either taking a wider stop to give the trade room, or using an arbitrary stop based on recent price action rather than meaningful structure.
Arbitrary stops versus structurally-placed stops produce completely different risk profiles over time. When your stop is at a level that doesn't make structural sense, you're essentially guessing at where the market needs to go to prove you wrong. That's not a system. That's hope with a limit order attached.
Structural stops use the market's own logic. The trade is wrong when price takes out a specific structural level. That keeps risk defined and tied to something real rather than to a number you picked because it felt reasonable.
This is also why understanding support and resistance is inseparable from understanding market structure. Support and resistance aren't just places where you might enter. They're the structural framework that makes your stop placement logical.
Building a Market Structure Process You Can Actually Follow
If you want to use market structure as a genuine edge rather than a labeling exercise, here's the progression that actually works.
Start with a higher timeframe orientation. Before the session begins, identify the major structural reference points on the daily and weekly chart. Where are the meaningful swing highs and lows? Where is price relative to those levels? This becomes your contextual map for the day.
Then identify the intraday structural picture. Is price in a clear trend? Is it ranging? Is the structure showing signs of a potential reversal? Align what you see on the intraday with what you mapped on the higher timeframe. Conflict between timeframes means reduced position size or no trade at all.
Finally, require location before you act. Not just a pattern. A pattern in a place that makes structural sense. For trend continuation, you want the pullback to a meaningful level before re-entry. For reversals, you want evidence that the prior structure has actually failed, not just tested.
This three-part process is essentially what the Two Hour Trader framework teaches for a focused two-hour window each session. Rather than trying to trade every structural signal across the full day, the approach concentrates on the highest-probability window when structure tends to be cleanest and volume most genuine.
"That 2 hour trader is KILLER. A must to have in the tool belt." (DonMartin)
Consistency in structure-based trading comes from knowing when the conditions are right and passing on every pattern that forms anywhere else.
The Honest Ceiling
Market structure trading has a ceiling that most education won't tell you about.
At some level of market efficiency, particularly on shorter timeframes and in highly liquid instruments like NQ and ES, pure structural analysis becomes insufficient. Price moves fast enough that by the time a structural confirmation is clean, the entry is no longer optimal. This is one reason why traders who have spent years developing structural intuition begin layering in volume analysis, order flow, and institutional-level reference points.
The Thinktank exists partly for this reason. There's a limit to how much you can extract from self-study with charts. Trading alongside people who see and read structural conditions every day accelerates the pattern recognition that takes years to develop alone.
But the structural foundation still has to be there first. Volume and order flow analysis on top of a flawed structural read doesn't fix the problem. It adds complexity to a broken base.
Learn to read structure accurately. Learn where it matters and where it's noise. Then, and only then, does adding layers actually improve your edge rather than just adding confusion.
Market structure is the foundation. But reading it correctly requires context, location, and the discipline to stay out when conditions don't meet your criteria. That's a harder skill than drawing higher highs on a chart. It's also the one that actually pays.