
The Five Reference Levels That Separate Professional Futures Traders from Everyone Else
I'll never forget the morning I watched a newer trader in our community attempt to scalp ES futures without a single level marked on his chart. He was trading blind, reacting to every wiggle, getting chopped up in both directions. When I asked him where he expected resistance, he just shrugged. "I'm reading the tape," he said.
He blew through his daily loss limit in forty minutes.
Here's what he didn't understand: professional traders aren't smarter than you. They don't have secret indicators or magic algorithms. But they do have one massive advantage—they know exactly where the battlefield lines are drawn before the first shot is fired.
Every morning before the opening bell, institutional traders, algorithms, and experienced retail traders are all doing the same thing. They're marking their levels. These aren't random lines or hopeful guesses. They're specific price reference points that everyone is watching, which makes them self-fulfilling. When enough traders see the same level, price reacts. It's that simple.
But here's the thing most traders miss: these levels aren't buy or sell signals. They're context. They're tools for adding confluence to trade ideas you're already monitoring. They help you understand where support and resistance might show up, where liquidity pools sit, and where the big players are making their decisions.
Let me walk you through the five reference levels I mark every single day—and more importantly, how to actually use them without falling into the trap of trading levels in isolation.
Why Reference Levels Matter More Than You Think
Before we dive into the specific levels, let's clear something up. A lot of traders approach reference points the wrong way. They see price hit prior day high and immediately short it. Price touches overnight low and they blindly go long. This is backwards.
Reference levels work because they represent areas where supply and demand historically clashed. They're zones where previous traders made decisions, placed stops, took profits, or got trapped. Understanding market structure means understanding these decision points and how price tends to react when it revisits them.
The power isn't in the level itself—it's in the confluence. When multiple reference points stack up at the same price zone, that's when you pay attention. When price approaches a key level while you're already stalking a setup based on your strategy, that's when the level adds weight to your decision.
As one member of our trading community put it: "The daily trade reviews are very important for my development as a trader. By consistently analyzing my previous trades I'm getting more important insights to refine my trading system." That refinement often comes from recognizing which reference levels mattered and which didn't in your specific setups.
Level 1: Prior Day High & Low (PDH/PDL)
Let's start with the most universally watched levels in all of trading: yesterday's high and low.
The prior day high (PDH) is the highest price reached during the previous day's Regular Trading Hours session—for US markets, that's 9:30 AM to 4:15 PM Eastern. The prior day low (PDL) is the lowest price from that same session. These levels reset every day when a new session begins.
Why does everyone watch these? Because they represent yesterday's accepted range. Everything that happened yesterday—all the institutional orders, all the retail trades, all the algorithmic decisions—happened within that range. When price approaches these boundaries, everyone wants to know the same thing: will we expand or reject?
Here's how I use them. If price is basing just below PDH and I'm already looking for a long setup based on trend or structure, clearing PDH becomes my confirmation. It's not the reason I take the trade—it's the confirmation that my idea has legs. PDH isn't resistance until it proves itself as resistance.
Same thing in reverse. If I'm watching for a short opportunity and price grinds up into PDH, shows weakness, then rolls over—that's confluence. The level alone didn't give me the trade, but it gave me a logical zone to watch for the pattern I was hunting.
One critical detail most traders miss: pay attention to HOW price approaches these levels. A slow, grinding approach into PDH suggests exhaustion. A sharp spike suggests momentum that might punch through. The character of the move matters as much as the level itself.
Common trap: Don't assume every touch of PDH or PDL will bounce. Context always matters. In a strong trend, price will blow through yesterday's range without a second thought. In a choppy, range-bound environment, these levels become more significant as range boundaries.
Level 2: Overnight High & Low (ONH/ONL)
While most retail traders are asleep, the overnight futures session is setting up tomorrow's battlefield. The overnight high (ONH) and overnight low (ONL) often become the first major targets when Regular Trading Hours open.
The overnight session runs from 6:00 PM to 9:30 AM Eastern—basically, the entire Globex session leading into the RTH open. During these hours, international markets move, news drops, and institutional orders get filled. The high and low from this session tell you where price couldn't break during the night.
Here's why this matters for your morning trading. If RTH opens and then trades above the overnight high, you've got an immediate bullish signal. The ONH now flips to support. If you were already leaning long based on overnight action or premarket sentiment, this gives you a concrete level to lean against.
If RTH opens then trades below the overnight low, you've got the opposite setup. ONL becomes resistance. Any bounce back toward it becomes a potential short opportunity if you're already thinking bearish.
But the most interesting scenario is when RTH opens inside the overnight range. Now ONH and ONL become your first upside and downside targets. This is where patience pays off. The first 30 to 60 minutes of the session often involves a test of one of these levels. Let price show you which level it wants to challenge, then watch how it behaves when it gets there.
Level 3: Volume Point of Control (VPOC)
Now we're getting into the good stuff. While price gets all the attention, volume tells you where the real business happened. The Volume Point of Control (VPOC) is the price level where the most volume traded during a session.
Think about what this represents. At the VPOC, buyers and sellers reached maximum agreement. The most contracts changed hands there. It's the fairest price from yesterday's auction. And here's the key insight: price tends to gravitate back toward fair value.
I use prior day VPOC as both a magnet and a barrier. If price is trading above yesterday's VPOC and rallies away from it without looking back, that's strength. The market is saying, "We've found new value higher." If you were thinking about entering a long, this price action adds confidence.
But if price is meandering above VPOC and keeps getting pulled back down to test it, that's a different message. VPOC is acting as a support zone, absorbing buying interest. If you're watching for a long setup, a clean bounce off VPOC in an uptrend is high-probability. You're buying where institutional traders already proved there's demand.
The flip side works too. If price rallies up to prior day VPOC during a downtrend, watch for rejection. Big volume traded there yesterday, which means there's likely supply waiting. If your strategy already has you looking for short entries, VPOC rejection gives you a logical spot to execute.
One of our mentorship clients told me: "I've been trading for the past 3 years, I've been everywhere, in 9 different chats, I've seen everything. The value I found when I joined the PTG team was unparalleled." Part of that value comes from understanding how to combine VPOC with other reference points for maximum confluence.
Here's a pro insight: when VPOC sits near PDH or PDL, that level becomes extra significant. You've got the volume acceptance from yesterday meeting the range extreme from yesterday. That's a double reason for price to react.
Common mistake: Treating VPOC like a precise line. It's a zone, not a level. Price doesn't need to hit it exactly to show you what you need to see.
Level 4: The Midnight Open
This one surprises people. Ask ten traders when the "day" starts and you'll get ten different answers. But for futures traders, midnight Eastern Time holds a special place.
The midnight open is exactly what it sounds like: the price at 12:00 AM ET. It represents the true calendar day open, which is different from the RTH open (9:30 AM) and different from the overnight session open (6:00 PM).
Now, I'm not going to pretend this is the most critical level on your chart. It's not. But here's why I still mark it: some institutional algorithms reset at midnight. That means there's programmatic interest at this level. And when you combine midnight open with other reference points—say it aligns with PDH or VPOC—suddenly it becomes more interesting.
I primarily use midnight open as a bias filter. Price above midnight open? I'm leaning bullish. Below? Leaning bearish. It's not a signal, it's context. It's one more data point in the constellation of information I'm using to read the session.
During the overnight and early morning session, price sometimes gravitates toward the midnight open or reacts at it. It's less crowded than PDH or PDL, which actually can make the reactions cleaner. Everyone's watching PDH. Not everyone's watching midnight open.
Think of it as a center of gravity. In choppy, range-bound sessions, the midnight open can act like a mean reversion anchor. Price wanders away, then drifts back. It's subtle, but once you start watching for it, you'll see it show up more than you'd expect.
The real power comes when it clusters with other levels. Midnight open sitting on top of VPOC? Now you've got two different reasons for price to respect that zone. That's the kind of confluence that turns a maybe-trade into a definitely-watch-this trade.
Level 5: Weekly Open & Last Week High/Low
Here's where we zoom out. Day traders obsess over daily reference points, and they should. But the bigger picture matters too, especially if you're holding positions beyond a single session or trying to understand the larger trend context.
The weekly open (WO) is the opening price of the trading week. For futures, that's Sunday at 6:00 PM Eastern when Globex reopens. Last week high (LWH) is the highest price from the prior trading week, and last week low (LWL) is the lowest.
These levels carry more weight than daily levels because they represent higher timeframe structure. When institutions are managing multi-day positions, they're watching weekly levels. When algorithms are determining trend direction, they're looking at whether price is above or below the weekly open.
I use weekly open similar to how I use midnight open, but with more conviction. Price above WO? My bias tilts bullish for the week. I'm looking for opportunities to get long on pullbacks rather than fade rallies. Price below WO? I'm hunting short setups and being more cautious with longs.
Last week's high and low matter even more. If price approaches LWH, that's a major test. Breaking above last week's high signals bullish expansion—the market is saying we're going higher. If you're a swing trader, this is your confirmation. If you're a day trader, this is your signal to respect the momentum and not fight it.
Same logic applies to LWL. Price testing last week's low is a critical moment. A clean break lower suggests we're expanding to the downside. A rejection off LWL can spark a significant bounce, especially if you're already watching for reversal patterns.
Pro tip: Combine weekly levels with daily levels for maximum insight. If PDH sits just below LWH, you've got a double layer of resistance. If PDL aligns with WO, you've got structural support meeting bias. These level clusters create the highest-probability zones.
Putting It All Together: The Morning Routine
Alright, here's how this actually works in practice. Every morning before the market opens, I do the same thing. I mark my levels. All of them. PDH, PDL, ONH, ONL, prior day VPOC, midnight open, weekly open, LWH, LWL.
This takes about two minutes once you know what you're doing. And those two minutes completely transform how I see the session unfolding.
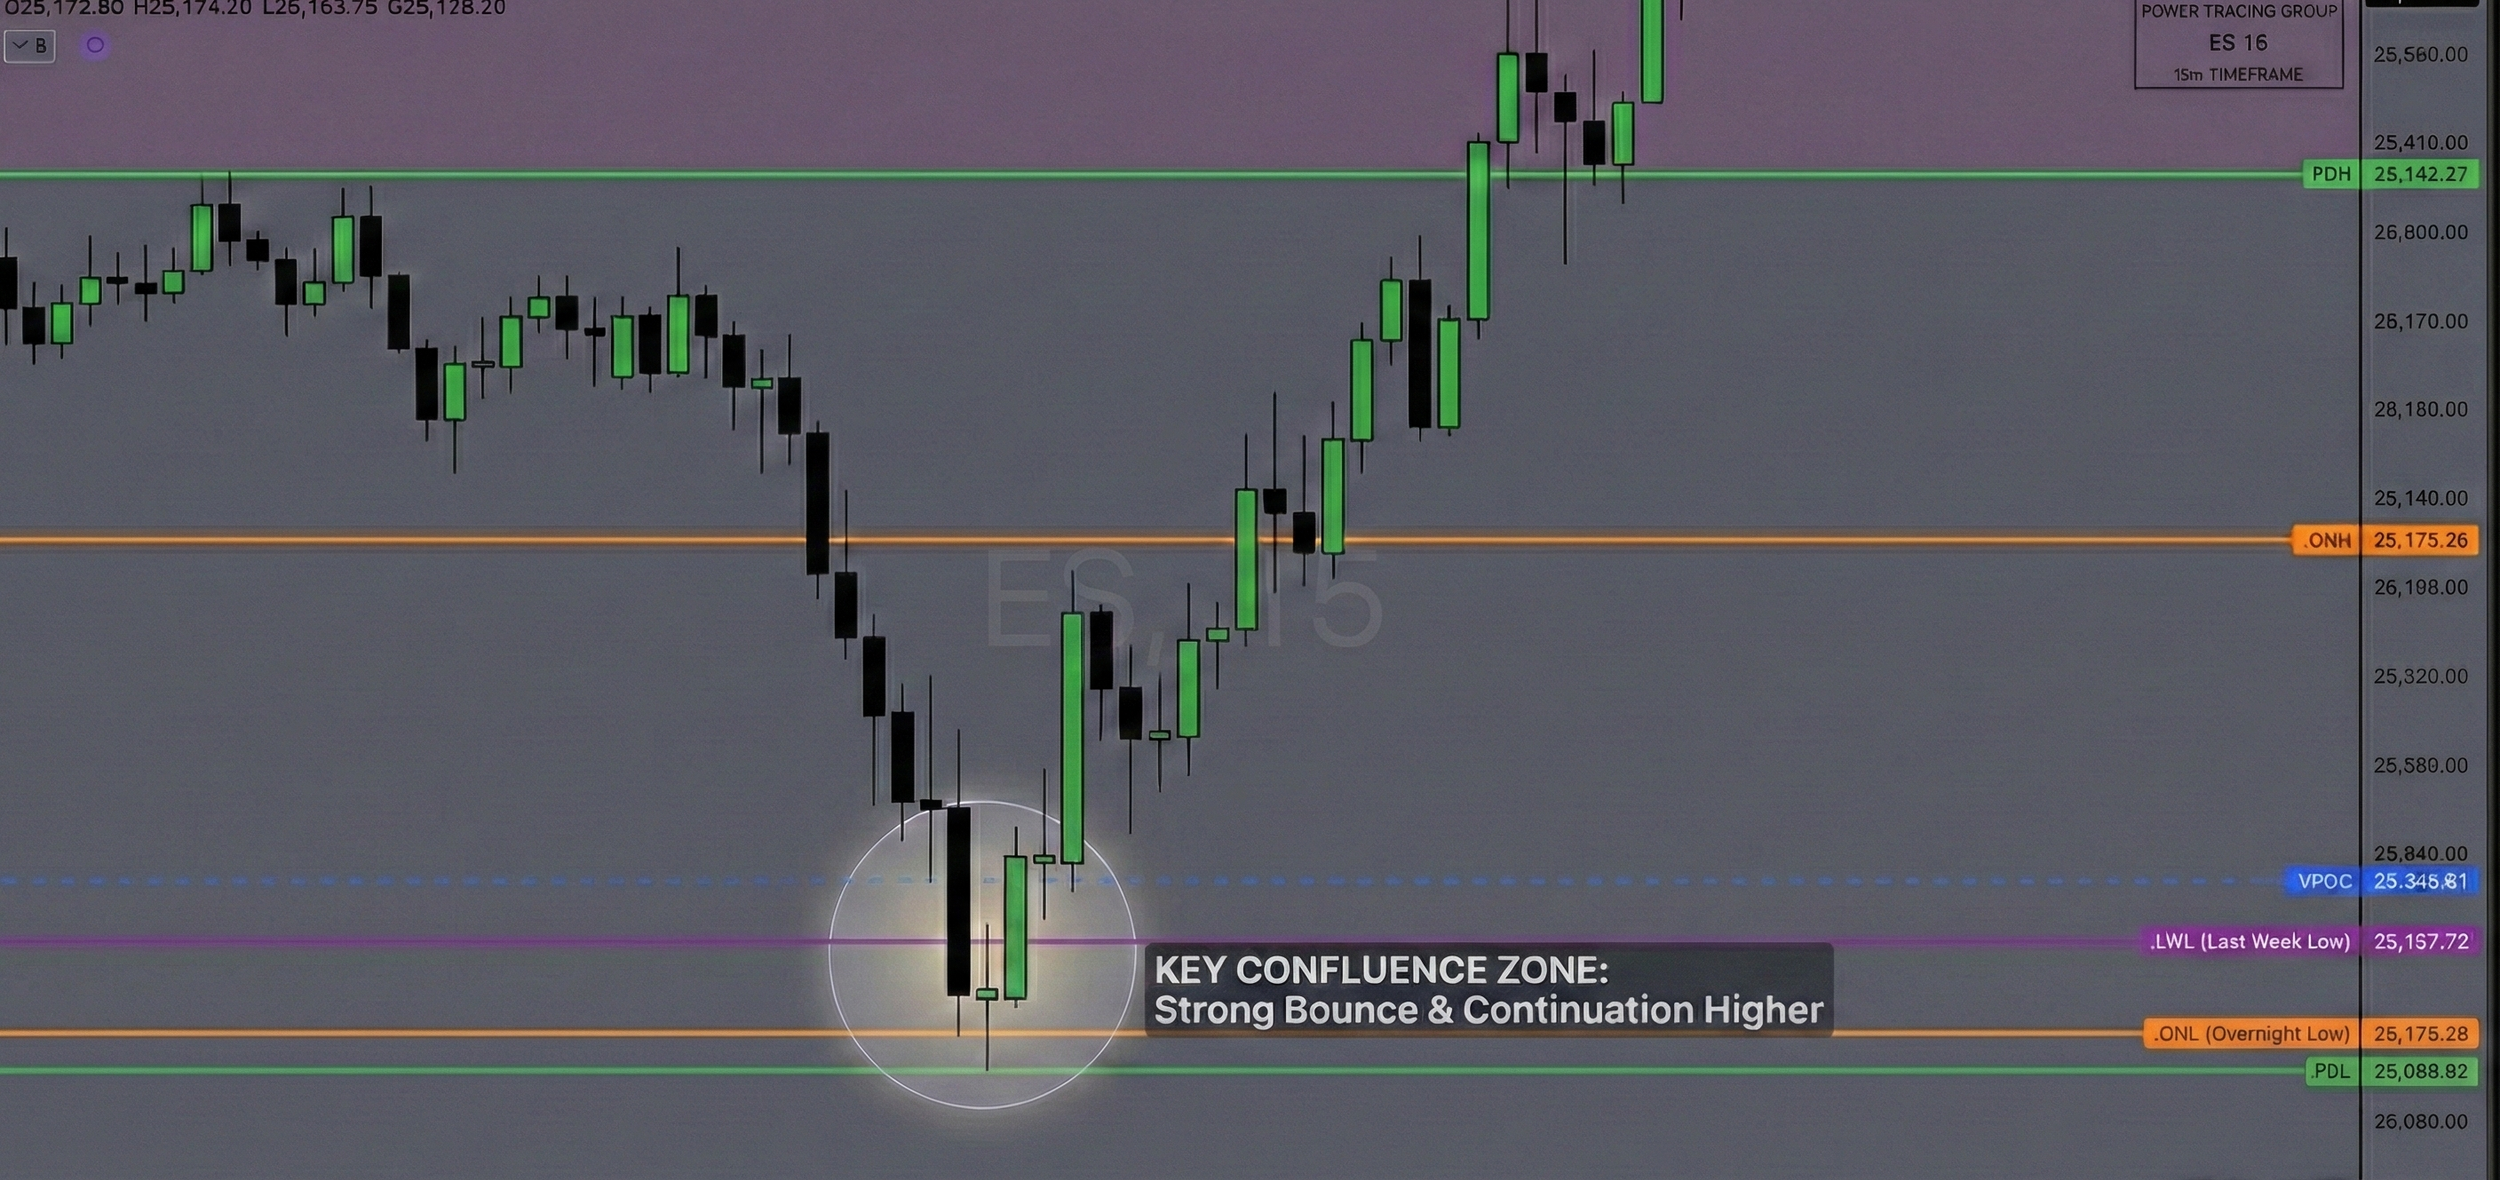
I'm looking for confluence. Where do multiple levels stack up? If PDL sits right on top of last week low, that's a fortress of support. If ONH aligns with prior day VPOC, that's a meaningful resistance zone. These clusters of levels are where the magic happens.
Then I watch how price interacts with these levels throughout the session. Does it respect them? Slice through them? Bounce hard off them? Each interaction tells me something about the character of the market that day.
The levels don't tell me to buy or sell. They tell me where to watch. They tell me where my trade ideas might get confirmation or rejection. They give me logical spots to enter, logical spots to take profit, logical spots to place stops.
After ten-plus years of trading, I can tell you this: traders who ignore reference levels are flying blind. And traders who trade reference levels without context are following a broken map. The skill is in understanding how these levels fit into your broader analysis of trend, structure, and momentum.
This is exactly what we work on inside the Trader's Thinktank—learning to read the market through the lens of structure and reference points, combined with disciplined execution. It's not just about knowing the levels exist; it's about developing the pattern recognition to know when they matter and when they don't.
Why I Built the PTG Reference Points Pro Indicator
Look, I'm going to be honest with you. Marking these levels manually every morning gets old fast. It's tedious. You have to pull yesterday's data, identify the VPOC, remember to adjust for the new weekly open on Sunday nights. And if you screw it up—which is easy to do when you're marking five to nine different levels—you're trading off wrong information.
That's why I built the PTG Reference Points Pro indicator.
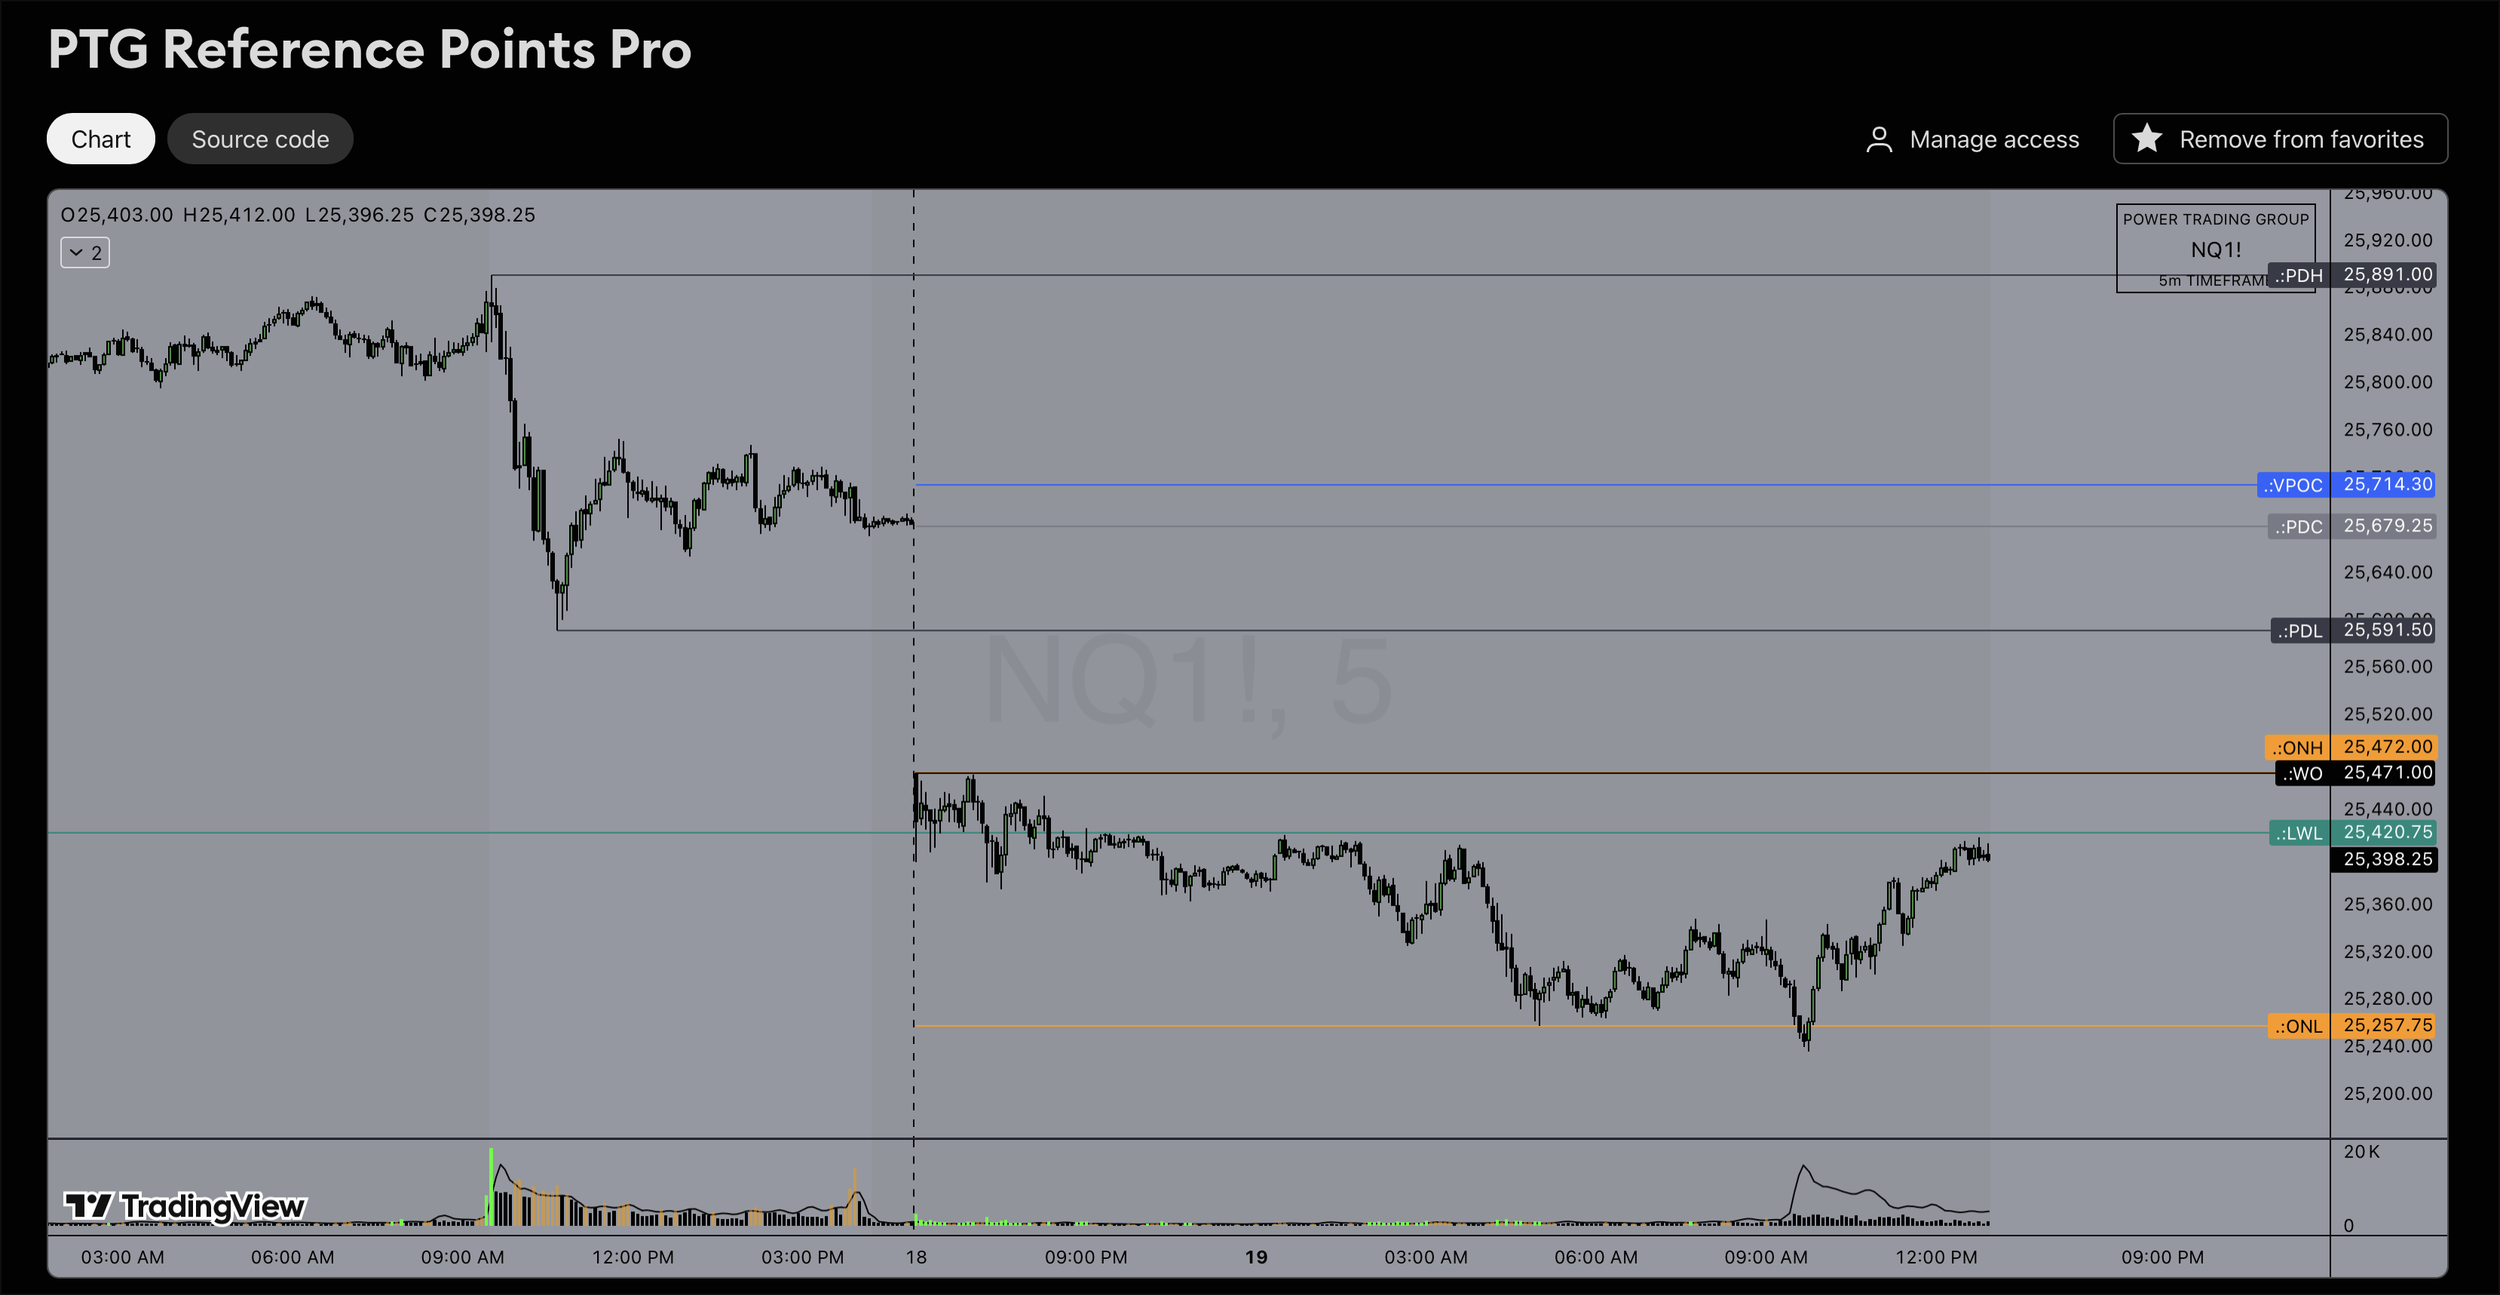
It automatically plots all of these levels: PDH, PDL, ONH, ONL, Prior Day VPOC, Midnight Open, Weekly Open, Last Week High, and Last Week Low. Every morning when I open my TradingView chart, they're already there. Color-coded, labeled, clean. I can focus on trading instead of charting.
The Pro version is available exclusively to members of the Trader's Thinktank. Inside the Thinktank, you get access to the indicator, plus daily live trading sessions, trade reviews, mentorship, and a community of serious traders all working on the same goals you are.
You can see exactly how the indicator works here: PTG Reference Points Pro on TradingView
Not ready to join yet? I also offer a free Lite version on TradingView that includes PDH, PDL, ONH, and ONL. Just search for Opinicus PDH/PDL/ONH/ONL Labels and you can start using it today. It won't have VPOC, midnight open, or weekly levels, but it'll get you started with the core daily reference points.
The Bottom Line
Reference levels aren't magic. They won't make you profitable by themselves. But they will give you the same view of the market that professional traders have. They'll help you add confluence to your setups, avoid getting trapped in bad spots, and understand where the real battles are happening.
The five levels we covered today—PDH/PDL, ONH/ONL, VPOC, midnight open, and weekly levels—form the foundation of how I read every single trading session. They're simple. They're objective. And they work.
Mark your levels every morning. Watch how price interacts with them. Use them to confirm the trade ideas you're already hunting based on your strategy. Don't trade them in isolation, and don't ignore them either.
Because the difference between trading blind and trading with clarity? It's often just a few well-placed lines on a chart.