
AutoPilot Trader V3: $306,405 Profit Across 1,045 Trades — Full Backtest Results
The Evolution of AutoPilot Trader: V3 Is Here
After months of optimization, refinement, and rigorous backtesting, we're releasing the most significant update to AutoPilot Trader since its launch.
AutoPilot Trader V3 isn't just an incremental improvement — it's a fundamental evolution in how the algorithm selects and executes trades.
The results speak for themselves: $306,405 in profit across 1,045 trades with a 3.58 Sharpe ratio.
Below, you'll find our full interactive performance dashboard with complete transparency on every metric that matters.
What's New in V3?
Before diving into the numbers, here's what changed:
1. Long-Only Strategies Now Available
Perfect for prop firm traders or anyone looking to reduce directional risk. Our NQ Long-Only strategy achieved a 4.05 Sharpe ratio in 1-year backtesting — that's a 28% improvement over V2's best performer (3.16).
If your prop firm restricts short selling or you simply prefer trading with the trend, V3 has you covered.
2. Expanded Instrument Support
V3 now supports:
NQ (Nasdaq-100 Futures) & MNQ (Micro Nasdaq)
YM (Dow Jones Futures) & MYM (Micro Dow) — NEW
Choose your capital commitment: from $50 micro contracts to full-size futures. The same proven strategy logic applies across all instruments.
3. Dramatically Tightened Trade Selection
This was the game-changer.
By refining our entry criteria, we reduced total trades from 867 (V2) to 547 (V3 2-Way) while improving the profit factor from 1.4 to 1.7.
Quality over quantity. Every signal matters more.
The result? Higher win rates, better risk-adjusted returns, and less exposure to marginal setups.
V3 Performance Dashboard: Full Transparency
The dashboard below shows our combined portfolio backtest running both NQ and YM strategies simultaneously with normalized position sizing (3 NQ contracts + 6 YM contracts).
This represents what a trader would have experienced deploying both instruments together over a 1-year period.
Key Performance Metrics Breakdown
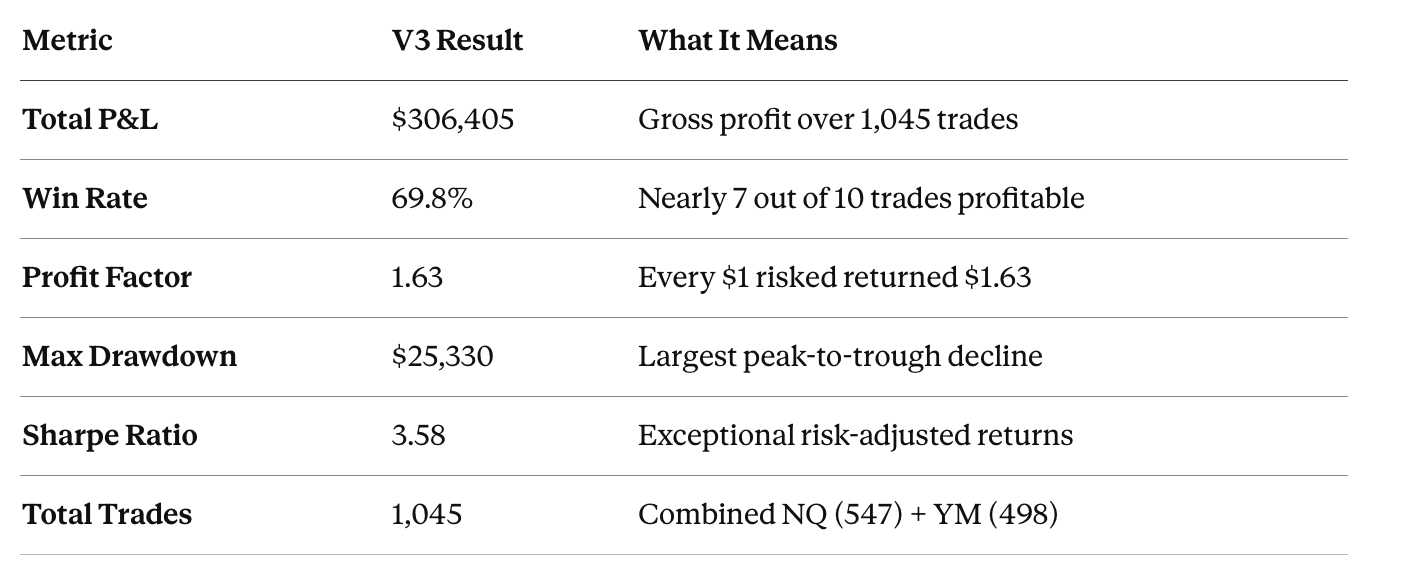
What These Numbers Actually Mean
Win Rate (69.8%): Industry average for retail traders hovers around 35-45%. A nearly 70% win rate means the algorithm is selective and precise.
Profit Factor (1.63): This measures gross profit divided by gross loss. Anything above 1.5 is considered strong. V3's 1.63 represents a significant improvement over V2's 1.4.
Sharpe Ratio (3.58): This is the gold standard for risk-adjusted performance. Most hedge funds target 1.0-2.0. A Sharpe of 3.58 indicates exceptional returns relative to volatility.
Max Drawdown ($25,330): Every strategy experiences drawdowns. What matters is recovery. The equity curve shows consistent recovery from every dip, demonstrating the algorithm's resilience.
Understanding the Equity Curve
The main chart shows cumulative P&L over all 1,045 trades with Monte Carlo confidence bands:
Blue line: Actual portfolio performance
Dark blue band: 50% confidence interval (where results land half the time)
Light blue band: 90% confidence interval (statistical range of outcomes)
Notice how the actual equity curve stays within the confidence bands throughout — this indicates the strategy performs consistently within expected statistical parameters.
Key observations:
Strong acceleration between trades 300-400 (capturing a favorable market regime)
Sideways consolidation from trades 450-700 (the algorithm preserved capital during chop)
Steady climb from trade 700 onward with controlled volatility
Monte Carlo Analysis: Why 100% Profit Probability Matters
Monte Carlo simulation runs 1,000 randomized iterations of the actual trade sequence to stress-test the strategy's robustness.
Results:
Profit Probability: 100% (all 1,000 simulations ended profitable)
90% Confidence Range: $194,195 – $410,121
Median Expected Return: $306,405
What this tells us: Even in worst-case scenarios (unlucky trade ordering, clustered losses), the strategy remained profitable. The $194k floor represents a reasonable worst-case expectation, while $410k represents the upside potential.
Strategy Breakdown: NQ vs YM Contribution
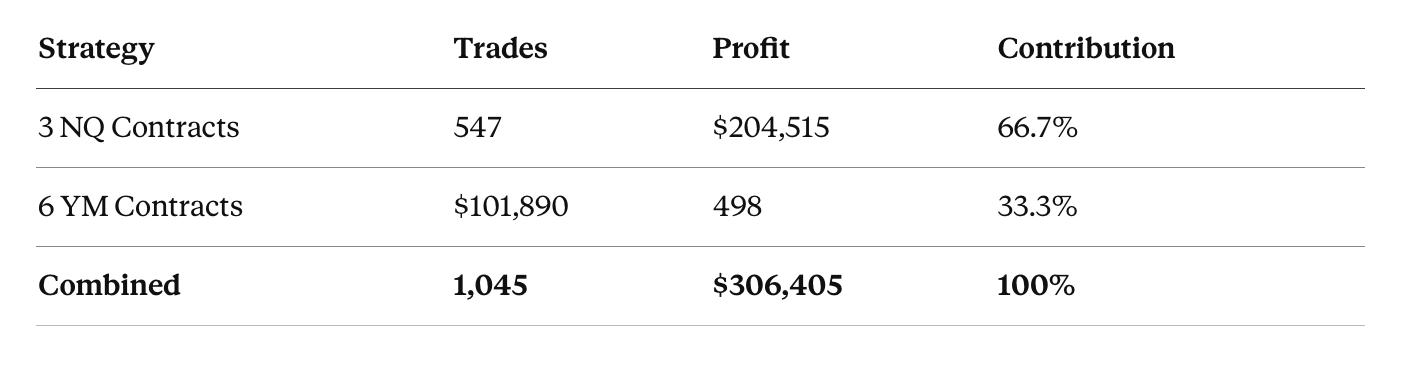
Why Run Both?
Diversification reduces correlation risk. NQ and YM don't always move together — when one instrument chops, the other may trend. Running both strategies smooths the equity curve and reduces drawdown severity.
The normalized position sizing (3 NQ : 6 YM) accounts for the different point values and volatility profiles of each instrument.
Before You Deploy: Calculate Your Position Size
A 69.8% win rate means nothing if you're over-leveraged for your account size.
Before deploying V3, use our Risk Calculator to determine:
Optimal contract size for your account
Expected drawdown scenarios based on real data
True risk exposure across different position sizes
👉 AutoPilot Trader Risk Calculator & Position Sizing Guide
This tool uses actual V3 trade data with Monte Carlo analysis to help you size positions correctly. Don't skip this step.
Frequently Asked Questions
How does V3 compare to V2?
V3 shows significant improvements across all key metrics:
Sharpe Ratio: 3.58 (V3) vs 3.16 (V2) — 13% improvement
Profit Factor: 1.63 (V3) vs 1.4 (V2) — 16% improvement
Trade Quality: Fewer trades, higher selectivity, better outcomes
Can I run just NQ or just YM?
Yes. V3 supports individual instrument deployment. You can run NQ-only, YM-only, or the combined portfolio based on your preference and account size.
Is the long-only strategy available for both instruments?
Yes. Both NQ and YM have long-only variants for prop firm traders or those preferring directional strategies.
What account size do I need?
We recommend a minimum of $10,000 for micro contracts (MNQ/MYM) or $25,000+ for standard contracts. Use the Risk Calculator to determine exact sizing.
How do I get access to V3?
All existing AutoPilot Trader license holders receive V3 automatically — no additional cost. New traders can secure a license here.
Ready to See V3 in Action?
AutoPilot Trader V3 represents the culmination of years of strategy refinement, real-world testing, and trader feedback.
The numbers don't lie:
$306,405 profit
69.8% win rate
3.58 Sharpe ratio
100% profit probability across 1,000 Monte Carlo simulations
If you're tired of manual trading, emotional decisions, and inconsistent results — V3 offers a proven alternative.
Performance disclaimer: Past performance is not indicative of future results. These results were achieved through backtesting with normalized position sizing (3 NQ + 6 YM contracts). Individual results will vary based on account size, market conditions, and execution. Never trade with money you cannot afford to lose. See full risk disclosure.