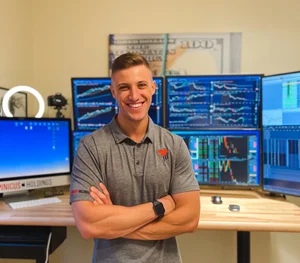
I took the overnight-low spring long on NQ, waited for a two-minute candle to close on elevated volume, and cut my size to two micros before I clicked. The opening structures that morning were huge, and I wanted my risk small relative to them. Price stopped me out just beneath the overnight low, which had been my invalidation point from the start, and then a big bearish 15-minute opening bar printed.
I said this on the stream right after:
"Thankfully dropped size on that trade. These structures are so massive."
That one sentence carries more of the Wyckoff methodology than most of the diagrams you'll find online. Those diagrams show a tidy accumulation range, a spring that dips under support, and price launching into markup. The methodology as I use it every day on NQ and ES is a way to decide in advance where a trade is wrong and how much that mistake is allowed to cost.
What the Wyckoff methodology covers
Richard Wyckoff built it in the early 1900s by studying how large operators accumulated and distributed stock. It rests on three laws and a four-phase cycle.
Supply and demand: price rises when demand outweighs supply and falls when supply outweighs demand.
Cause and effect: the time spent building a range (the cause) sets up the size of the move out of it (the effect).
Effort versus result: when heavy volume produces little price movement, someone on the other side is absorbing that effort, and the divergence tells you who is in control.
The four phases of Wyckoff are accumulation, markup, distribution and markdown. Large buyers build positions inside a range during accumulation, price advances in markup, the same players sell into strength during distribution, and markdown is the decline that follows. If you want the full history and the original five-step approach, I covered it in my Wyckoff Method breakdown.
The textbook version sells prediction
The standard teaching goes like this: label the phase, find the spring, buy it, ride markup. It sounds clean, and it breaks the first time you try it live.
Every Wyckoff chart in a book was labeled with the ending already known. A range looks like accumulation until it breaks down, and then it was distribution all along. When you're sitting at the right edge of a live NQ chart at 9:40 AM, the labels aren't there yet, and anyone who tells you the phase with certainty is guessing with confidence.
I think this is why people conclude the method has stopped working. They treated it as a forecast, got stopped out on a spring that was a real breakdown, and blamed Wyckoff. A verified member of our community described the same trap from the inside:
"Prior to joining, I was a predictor and anticipator. I didn't have proper rules of engagement. Since joining, I have learned to be patient and actually learned to trade."
Robert Onsomu
The same man who couldn't stop predicting could read an accumulation range fine. What he lacked was a rule for what happens when the read is wrong.
Walking the spring, failure included
The accumulation sequence has a standard vocabulary, and it's worth knowing because it gives you landmarks to trade around.
Preliminary support and selling climax: the first heavy-volume absorption, usually with panic in the tape.
Automatic rally and secondary test: these define the edges of the range, and the test comes back on lighter volume.
Spring: a poke below the range low that runs resting stops, then snaps back inside.
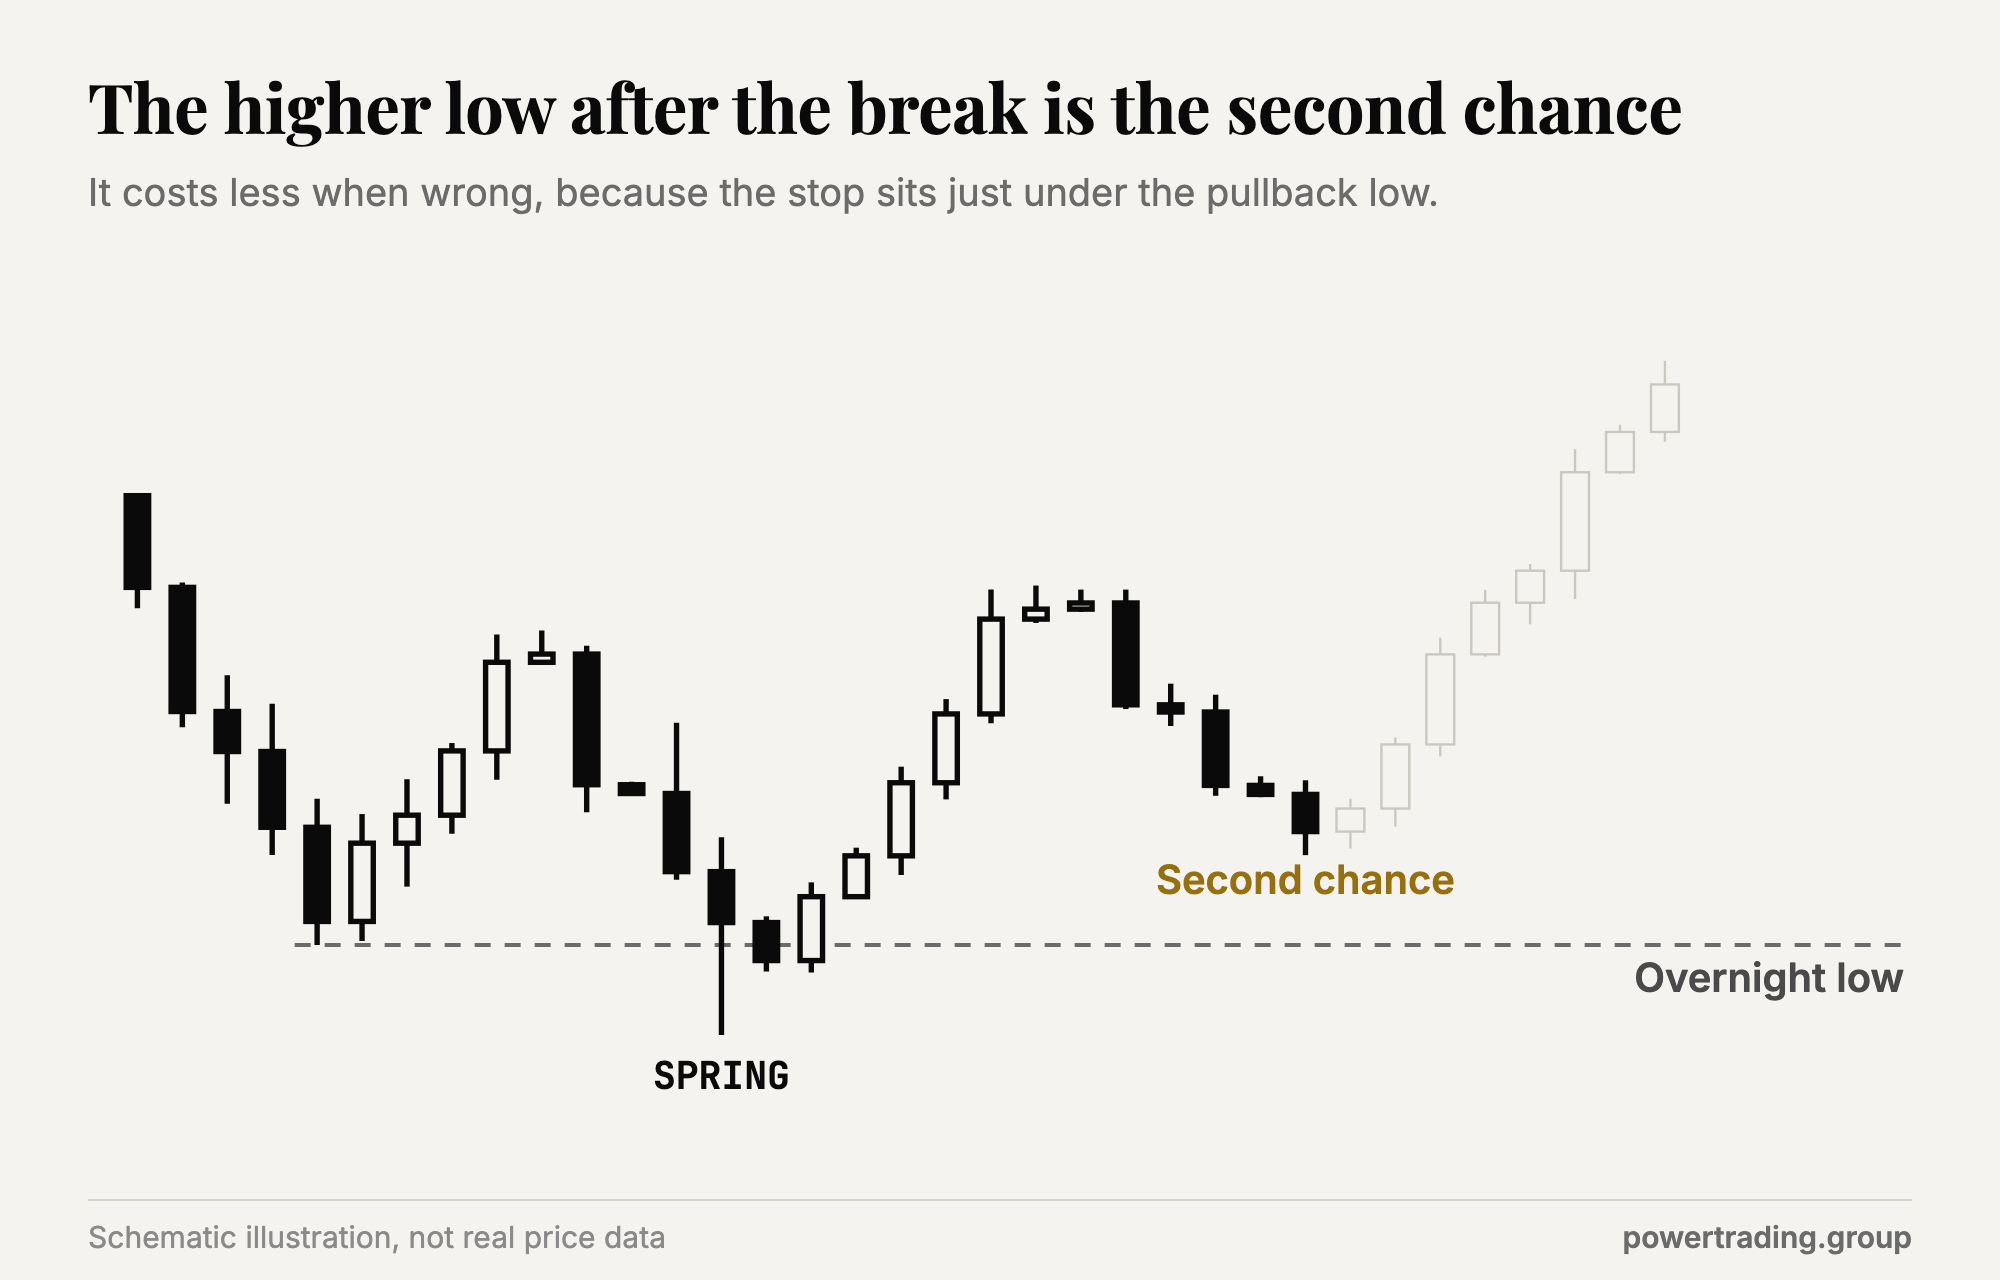
Sign of strength and last point of support: the break higher, then a higher-low pullback that offers a second chance.
A spring is a stop run. On NQ the overnight low is the obvious pool of stops, which is why I watch it so closely. Once price dips below it, I wait for a two-minute candle to close back inside on elevated volume. A trade below the low by itself is only a break. The close back inside, on volume, is the evidence of absorption.
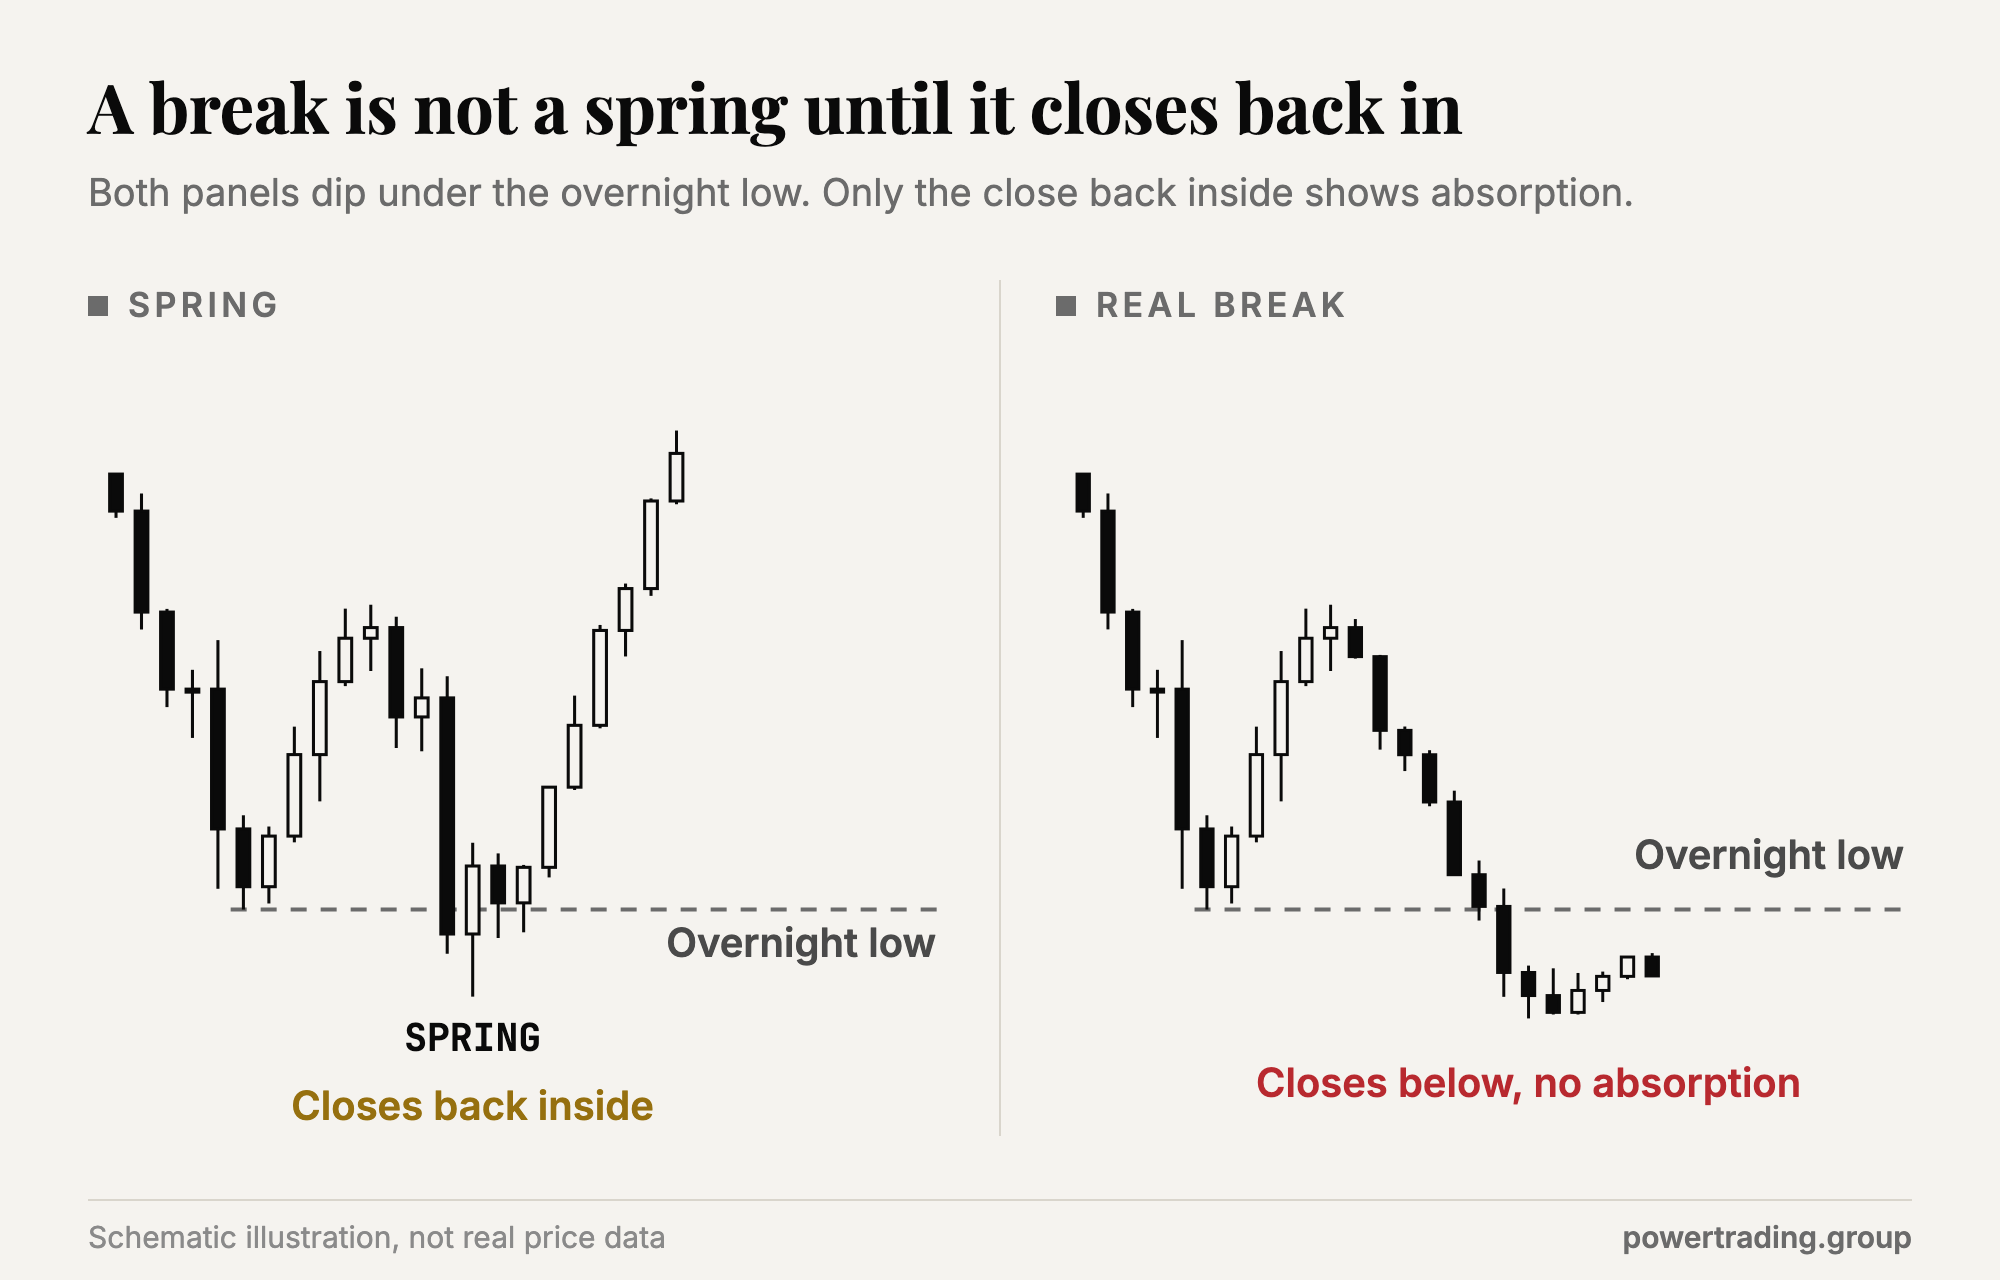
Even with that confirmation the setup can fail, and this one did. The stop sat just under the overnight low, a level I chose before entry, so the loss was defined before I had any feelings about it. I go deeper on the entry mechanics in my spring setup guide.
Size is the part nobody diagrams
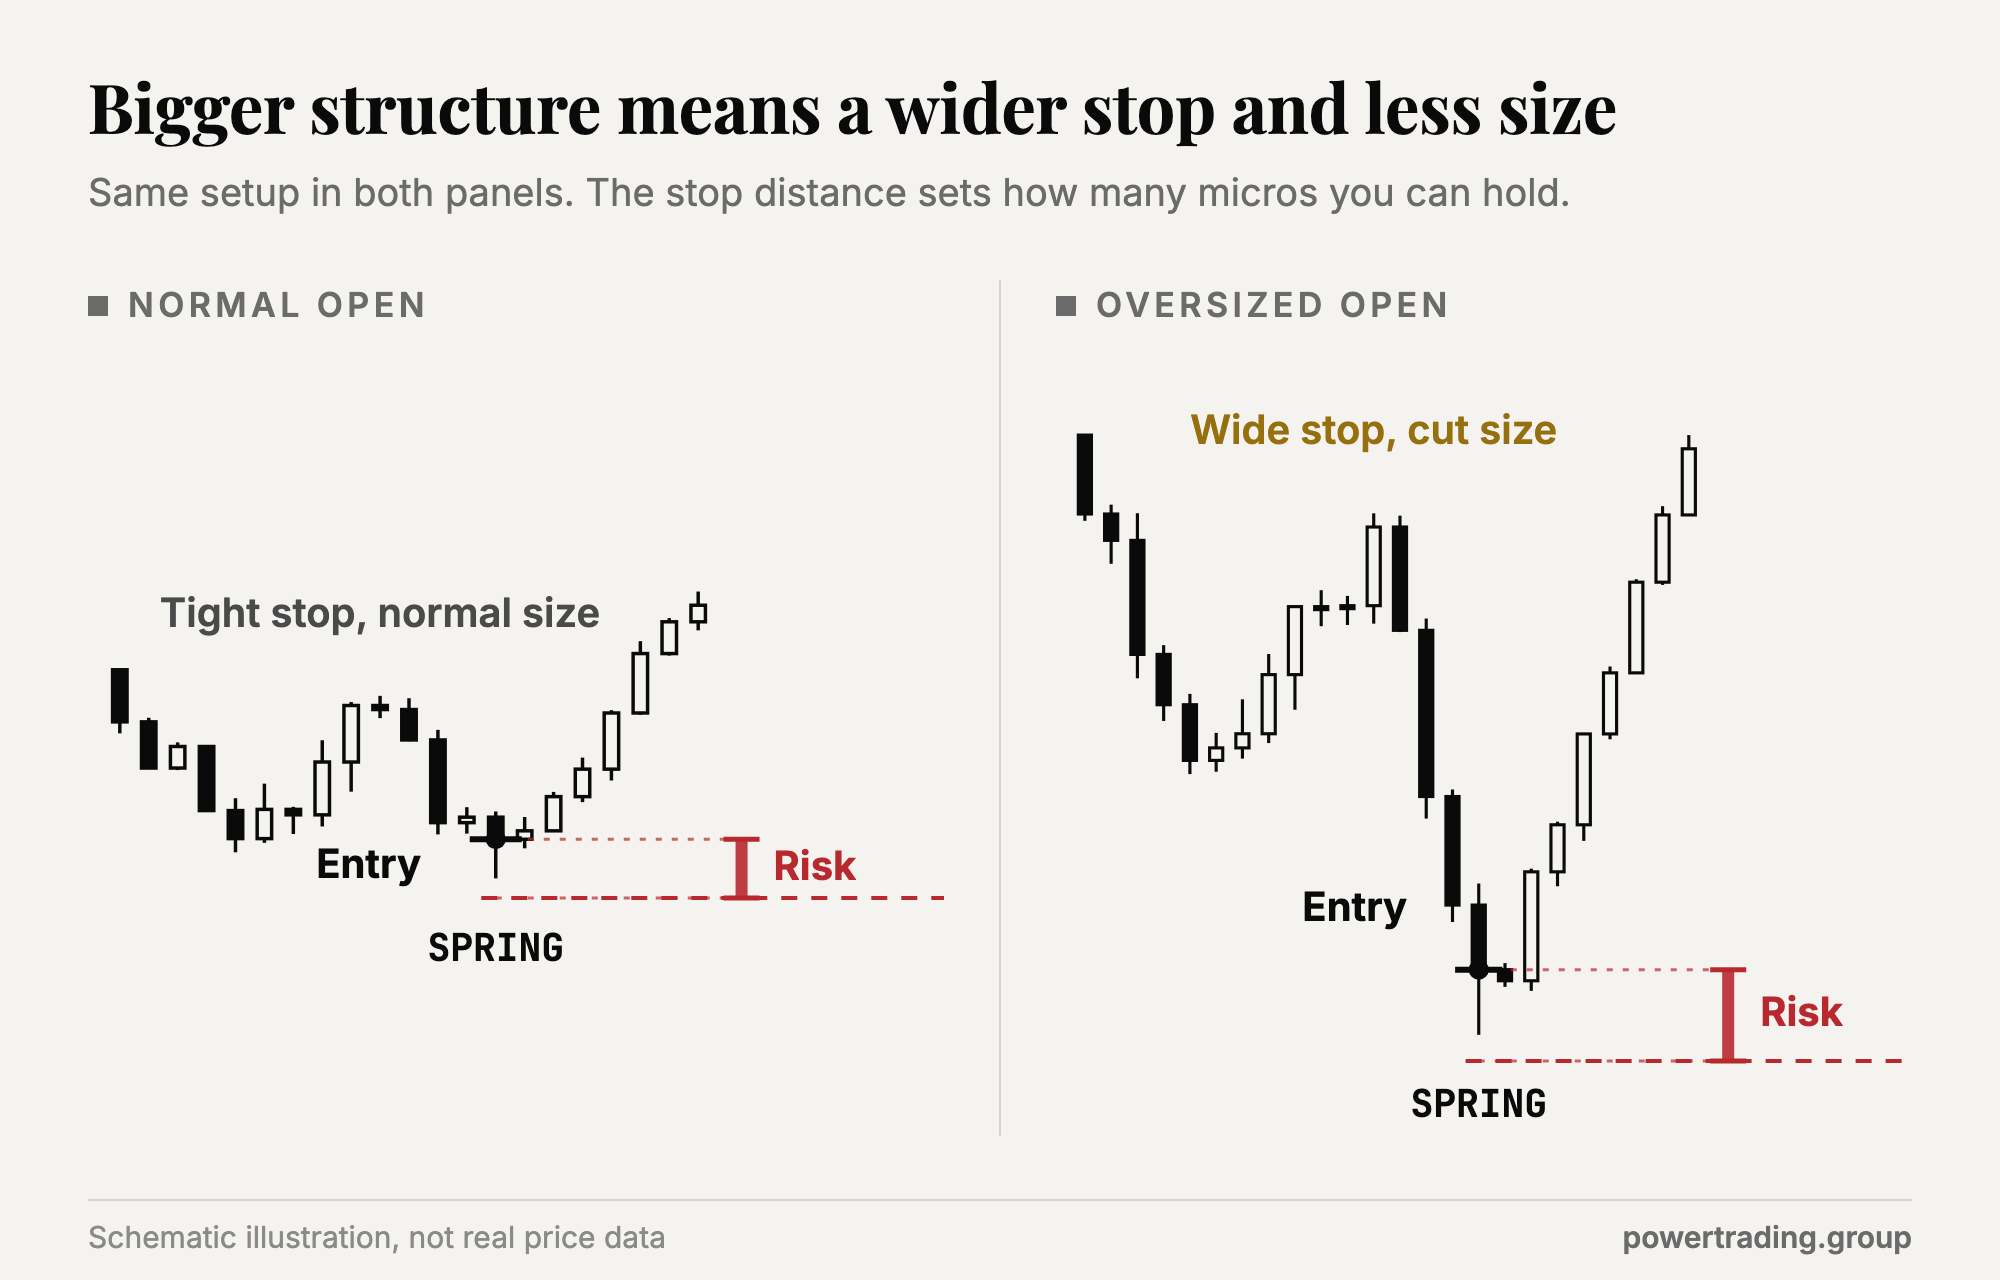
Cause and effect applies to your risk too. A bigger structure means a wider stop, and a wider stop means fewer contracts for the same dollar risk. The opening bars that day were enormous, so I dropped to two micros. Had I traded my normal size into that big bearish 15-minute bar, the failed spring would have wrecked my morning. At two micros it was a non-event, and I stayed clear-headed for the next read.
This is the part of trading discipline that doesn't make it onto YouTube thumbnails. Nobody screenshots the trade where they trimmed size and the market proved them right.
The same logic keeps me from catching falling knives. On another day NQ was sliding through the prior day low near 28K and the triple-zero level, and I told the room I had no interest in being the first buyer into that much weakness. A bounce attempt could easily get run over. I wanted a higher-low secondary entry, and I wasn't going to fade the move until 15 or 30 minute reversal candles showed up. They never did, so I called it an early weekend and set alerts. In Wyckoff terms I was waiting for the last point of support instead of buying the spring blind, and giving up the first tick bought me a filter against most of the traps.
Does the Wyckoff method still work on NQ?
Yes, and the reason is mechanical. Any auction market with resting orders has stops clustered around obvious highs and lows, and large participants need liquidity to build size. Futures with an overnight session show this cleanly, because the overnight high and low become magnets with a built-in reputation.
What has changed is the speed. Springs on NQ resolve in minutes, and the ranges can be large enough that a normal position size is reckless. So the method works as a framework for locations and risk, and it fails as a crystal ball.
Locations are the useful half. A member put it this way about the levels we map before the open:
"I don't use them for entries really but more for confluence and trade management. They are like a roadmap for me."
Jeff Stephens
That's how I treat range edges and overnight extremes. They tell me where to look, and the candle close and volume tell me whether to act. For a broader view of how this fits into reading structure, see my guide to understanding market structure.
How I apply it in a live session
Mark the edges before the open. Prior day high and low, the overnight high and low, and the range boundaries from the last few sessions.
Name the invalidation price first. If you can't point to the level where the idea is dead, you don't have a trade yet.
Wait for the candle close. A two-minute close back inside the range on elevated volume beats a wick that merely looked good.
Size from the stop distance. Then cut again when the open is oversized, as it was with those two micros.
Take the second chance. The higher-low after the break is often cleaner than the spring itself, and it costs you less when you're wrong.
Close the platform when nothing sets up. Ending the session is a legitimate trade.
Smaller size means smaller winners
That objection is fair. When the spring works, two micros pay less than a full-size position would have, and you'll feel that on the days it works perfectly.
I take that trade every time. A trade I can afford to lose lets me keep taking the next one with the same clear head, and consistency comes from having many chances to be right instead of one big bet. The truth about trading edge is that an edge only pays out across a large enough sample of trades, and oversized losses are what stop people from reaching that sample.
Where the Wyckoff pattern goes automatic
The spring is rules-based enough to automate. Spring, released September 28, 2026 inside AutoPilot Trader, trades a Wyckoff-based pattern on a faster chart (5-minute and 2-minute, each its own strategy) and behaves independently of the Two Hour Trader strategy. Every entry, stop and target is placed mechanically. All published figures for it are simulated and labeled that way, and you can see them with the drawdowns beside them on the performance page.
If you'd rather learn one setup by hand first, the Two Hour Trader is a 43-minute course on a single high-probability entry. And if you want to watch range edges, springs and size decisions play out live, we trade the open by hand every session in our Trader's Thinktank community. A member said it better than a pitch could:
"Unlike other groups focused on signals or watchlists, here you will learn to trade the market. To find your own identity as a trader."
Martin Chavez
The live room is where the sizing conversation happens in real time, and you can join the Trader's Thinktank to sit in on it.
Do this on your next range
Pull up yesterday's NQ chart and mark the overnight low. Write down the exact price where a spring long off that level would be wrong, then work out how many micros that stop distance lets you hold while risking an amount you'd shrug off. If the number looks too small to matter, the structure is telling you something, and cutting size before the open is how it gets heard.