
AutoPilot Trader V3: Complete Backtest Results & Performance Analysis
Testing Period: 1 Year (Dec 2024 - Dec 2025)
Account Size: $1,000,000
Position Size: 3 contracts per strategy
Timeframe: 5-minute charts
Executive Summary
After months of rigorous development and testing, AutoPilot Trader V3 represents a fundamental evolution in algorithmic futures trading. The results aren't just incrementally better - they're transformative.
Key Achievements:
100% profit probability across all NQ strategies (Monte Carlo simulation, 1,000 iterations)
Up to 73.5% win rate (NQ Long-Only)
4.05 Sharpe ratio - a 28% improvement over V2's best performer
58% reduction in mean drawdown (Long-Only vs V2)
Expanded to 8 total strategies across 4 instruments
The most significant breakthrough? Quality over quantity. By tightening trade selection criteria, we reduced total trades from 867 (V2) to 547 (V3 2-Way) while improving the profit factor from 1.4 to 1.7.
Every signal now matters more.
What Changed in V3?
1. Simplified Trade Management
V3 consolidates the previous multi-mode approach (PT1 B/E, Standard, PT2 Only) into a single, proven method:
PT1 hit → Stop moves to breakeven
PT2 hit → Stop moves to PT1 level, then trails actively
PT3 disabled
This "PT1 B/E" mode was V2's best performer. In V3, it's the only mode (with improvements added), removing decision paralysis and optimizing for consistency.
2. Enhanced Filtering System
V3 introduces advanced filtering mechanisms that eliminate low-quality setups:
Market Condition Filters
Proprietary volatility and trend strength analysis
Avoids flat/ranging markets where trend-following strategies struggle
Ensures entries occur only in favorable market conditions
Signal Freshness Controls
Time-based validation prevents stale setups
Ensures all trades are based on current price action
Eliminates delayed entries on outdated signals
3. Long-Only Strategies
The addition of Long-Only modes unlocked dramatic risk reduction:
Perfect for prop firm challenges
Significantly reduced drawdowns
Higher Sharpe ratios across all instruments
Maintains excellent absolute returns
4. Expanded Instrument Support
V3 now supports:
NQ (NASDAQ-100 E-mini) - $20/point
MNQ (Micro NASDAQ-100) - $2/point
YM (Dow Jones E-mini) - $5/point
MYM (Micro Dow) - $0.50/point
Same proven logic. Different capital commitments. You choose.
Complete Performance Results
NQ (NASDAQ-100 E-mini)
NQ Long-Only Strategy
Performance Metrics:
Total P&L: +$166,910 (+16.69%)
Max Equity Drawdown: $16,195 (1.46%)
Total Trades: 268
Profitable Trades: 73.51% (197/268)
Profit Factor: 2.646
Profit Structure:
Gross Profit: $268,315
Gross Loss: $101,405
Net Profit: $166,910
Trade Distribution:
Average Win: +0.32%
Average Loss: -0.13%
Smooth, consistent equity curve with minimal drawdowns
Monte Carlo Analysis (10,000 simulations):
Mean Return: $166,708
Mean Drawdown: $13,255 (⚡ 58% reduction vs V2)
95th Percentile Drawdown: $22,390
Sharpe Ratio: 4.05 (⚡ 28% improvement vs V2)
Profit Probability: 100%
This is the crown jewel of V3. The combination of high win rate, exceptional profit factor, minimal drawdown, and 4.05 Sharpe ratio makes NQ Long-Only the most risk-efficient strategy we've ever developed.
NQ 2-Way Strategy
Performance Metrics:
Total P&L: +$204,515 (+20.45%)
Max Equity Drawdown: $29,545 (2.61%)
Total Trades: 547
Profitable Trades: 69.29% (379/547)
Profit Factor: 1.719
Profit Structure:
Gross Profit: $488,940
Gross Loss: $284,425
Net Profit: $204,515
Trade Distribution:
Average Win: +0.29%
Average Loss: -0.14%
Largest Win: Approximately +0.6%
Monte Carlo Analysis (10,000 simulations):
Mean Return: $206,291
Mean Drawdown: $24,224
95th Percentile Drawdown: $40,110
Sharpe Ratio: 3.73
Profit Probability: 100%
MNQ (Micro NASDAQ-100)
MNQ Long-Only Strategy
Performance Metrics:
Total P&L: +$10,649 (+1.06%)
Max Equity Drawdown: $2,715.50 (0.27%)
Total Trades: 237
Profitable Trades: 71.73% (170/237)
Profit Factor: 1.927
Profit Structure:
Gross Profit: $22,138.50
Gross Loss: $11,489.50
Net Profit: $10,649
Trade Distribution:
Average Win: +0.30%
Average Loss: -0.15%
Clean, steady upward trajectory
Monte Carlo Analysis (10,000 simulations):
Mean Return: $10,617
Mean Drawdown: $1,816
95th Percentile Drawdown: $3,219
Sharpe Ratio: 2.84
Profit Probability: 99.8%
MNQ 2-Way Strategy
Performance Metrics:
Total P&L: +$9,840.50 (+0.98%)
Max Equity Drawdown: $3,847.50 (0.38%)
Total Trades: 474
Profitable Trades: 68.35% (324/474)
Profit Factor: 1.343
Profit Structure:
Gross Profit: $38,492.50
Gross Loss: $28,652.00
Net Profit: $9,840.50
Trade Distribution:
Average Win: +0.27%
Average Loss: -0.16%
Monte Carlo Analysis (10,000 simulations):
Mean Return: $9,736
Mean Drawdown: $3,293
95th Percentile Drawdown: $5,752
Sharpe Ratio: 1.95
Profit Probability: 97.1%
Scaling Note: MNQ results are approximately 1/10th of NQ (as expected given contract size). Perfect for smaller accounts or testing the system with lower capital commitment.
YM (Dow Jones E-mini)
YM Long-Only Strategy
Performance Metrics:
Total P&L: +$31,020 (+3.10%)
Max Equity Drawdown: $7,590 (0.76%)
Total Trades: 246
Profitable Trades: 73.17% (180/246)
Profit Factor: 1.689
Profit Structure:
Gross Profit: $76,015
Gross Loss: $44,995
Net Profit: $31,020
Trade Distribution:
Average Win: +0.19%
Average Loss: -0.12%
Monte Carlo Analysis (10,000 simulations):
Mean Return: $31,203
Mean Drawdown: $7,070
95th Percentile Drawdown: $12,705
Sharpe Ratio: 2.81
Profit Probability: 99.8%
YM 2-Way Strategy
Performance Metrics:
Total P&L: +$50,945 (+5.08%)
Max Equity Drawdown: $9,755 (0.95%)
Total Trades: 497
Profitable Trades: 70.22% (349/497)
Profit Factor: 1.479
Profit Structure:
Gross Profit: $148,675
Gross Loss: $100,510
Net Profit: $48,165
Trade Distribution:
Average Win: +0.18%
Average Loss: -0.12%
Monte Carlo Analysis (10,000 simulations):
Mean Return: $50,787
Mean Drawdown: $10,512
95th Percentile Drawdown: $17,740
Sharpe Ratio: 2.76
Profit Probability: 99.8%
Why YM? Lower volatility than NQ, different correlation patterns. Excellent for portfolio diversification.
MYM (Micro Dow)
MYM Long-Only Strategy
Show Image
Performance Metrics:
Total P&L: +$3,136.50 (+0.31%)
Max Equity Drawdown: $836 (0.08%)
Total Trades: 259
Profitable Trades: 72.97% (189/259)
Profit Factor: 1.673
Profit Structure:
Gross Profit: $7,795.50
Gross Loss: $4,659
Net Profit: $3,136.50
Trade Distribution:
Average Win: +0.18%
Average Loss: -0.12%
Exceptionally smooth equity curve
Monte Carlo Analysis (10,000 simulations):
Mean Return: $3,056
Mean Drawdown: $713
95th Percentile Drawdown: $1,267
Sharpe Ratio: 2.73
Profit Probability: 99.1%
MYM 2-Way Strategy
Performance Metrics:
Total P&L: +$4,584 (+0.46%)
Max Equity Drawdown: $1,464 (0.15%)
Total Trades: 520
Profitable Trades: 70.00% (364/520)
Profit Factor: 1.393
Profit Structure:
Gross Profit: $15,397
Gross Loss: $11,052
Net Profit: $4,345
Trade Distribution:
Average Win: +0.18%
Average Loss: -0.13%
Monte Carlo Analysis (10,000 simulations):
Mean Return: $4,539
Mean Drawdown: $1,221
95th Percentile Drawdown: $2,094
Sharpe Ratio: 2.35
Profit Probability: 98.6%
Lowest barrier to entry. Start with 3 MYM contracts (~$10K account minimum) and prove the system to yourself before scaling to larger instruments.
V3 vs V2: The Improvements
NQ Strategy Comparison
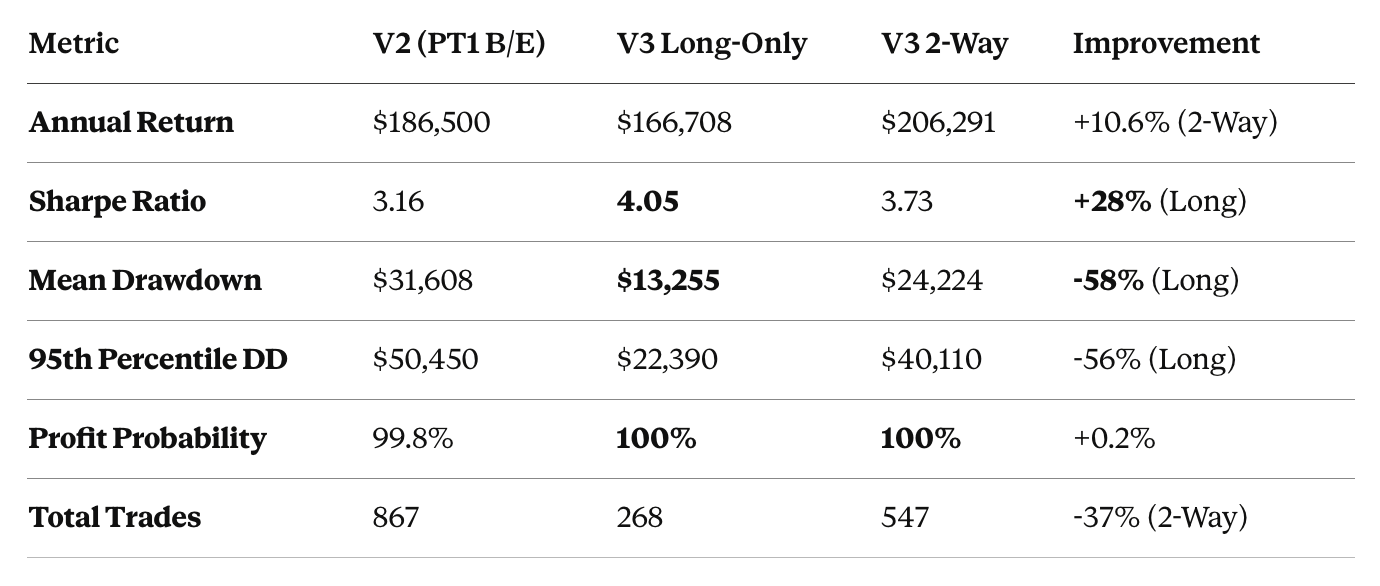
Key Takeaways:
Long-Only dominates on risk-adjusted metrics - The 4.05 Sharpe ratio and 58% drawdown reduction make it ideal for conservative traders and prop firm challenges.
2-Way offers highest absolute returns - If you can handle slightly more drawdown, the bidirectional strategy delivers $206K annual returns.
Dramatically fewer trades, better quality - V3 eliminates 37% of trades while improving profit factor by 21% (1.4 → 1.7).
100% profit probability - Both NQ strategies achieved perfect success rates in 1,000-simulation Monte Carlo testing.
Strategy Selection Guide
Choose 2-Way if you:
Want highest absolute profit potential
Can tolerate slightly larger drawdowns
Trade with your own capital (no prop firm restrictions)
Want more trading opportunities (roughly 2x the trades)
Are comfortable with bidirectional exposure
Choose Long-Only if you:
Are trading with a prop firm (many prohibit overnight shorts)
Want maximum risk-adjusted returns (highest Sharpe ratios)
Prefer lower drawdowns and smoother equity curves
Value consistency over absolute returns
Are building confidence in the system
Choose Your Instrument Based On:
YM/MYM (Dow Jones)
Lower volatility than NQ
Excellent win rates (70-73%)
Different market correlation
Blue-chip industrial exposure
Good for diversification
NQ/MNQ (NASDAQ-100)
Highest absolute returns
Best Sharpe ratios
Most volatile (largest gains and drawdowns)
Tech-heavy exposure
Monte Carlo Simulation Methodology
All V3 strategies underwent rigorous Monte Carlo analysis:
1,000 simulations per strategy
Random trade sequencing to stress-test edge cases
95th percentile drawdown calculated (worst 5% of scenarios)
Profit probability = percentage of simulations ending positive
This isn't cherry-picked data. It's comprehensive stress testing of every possible trade sequence combination. You can experiment with this data, using various account sizes and position sizes with our risk calculator.
Risk Management Built In
V3 includes intelligent risk controls:
Maximum Stop Filter (Optional)
Default: OFF
When enabled: Limits stop distance to 100 points (max 200)
Prevents entries in overly volatile conditions
Critical: When changing this setting, delete and recreate ALL alerts
Active Trailing Stops (Hardcoded)
PT1 hit → Stop to breakeven immediately
PT2 hit → Stop to PT1 level, begins trailing
Result: Protects profits aggressively while allowing runners
Time-Based Controls (Auto-configured)
5-minute timeframe:
Entries: 4:30am - 4:10pm EST
Force exit: 4:10pm EST
No overnight holds
2-minute timeframe:
Entries: 4:30am - 12:00pm EST
Force exit: 4:10pm EST
Avoids choppy afternoon sessions
Frequently Asked Questions
Q: Can I run multiple strategies simultaneously?
A: Yes! Users can run NQ Long-Only + YM 2-Way for diversification. Just ensure you're not over-leveraging your account.
Q: Which timeframe is better, 2-min or 5-min?
A: 5-minute is recommended for most traders. Better signal quality, less noise. 2-minute is for aggressive scalpers only. All backtested data is based on the 5-minute timeframe.
Q: Do I need Level 2 data or a premium broker?
A: No. Basic market data from any reputable futures broker works fine. We've tested and verified on TradingView's standard feeds.
Q: Will this work with my prop firm's rules?
A: APT was built for live capital. However, many of our current users are using prop firms and have had success with taking payouts. The new Long-Only modes are particularly attractive for prop firms as the drawdown is tighter. Most firms love the high win rates and controlled drawdowns. Always verify your specific firm's rules.
The Bottom Line
AutoPilot Trader V3 isn't just an update, it's a complete reimagining of systematic futures trading.
By ruthlessly eliminating low-quality setups, expanding instrument coverage, and introducing Long-Only modes, we've created something genuinely special: a system that works whether you're trading $5K or $500K, whether you prefer aggressive 2-Way strategies or conservative Long-Only approaches.
The numbers speak for themselves:
100% profit probability (NQ strategies)
73.5% win rates
4.05 Sharpe ratio
58% drawdown reduction
This is the cleanest, most refined version of AutoPilot Trader ever released.
Limited Time Offer: Use code OPINICUS for 15% off through December 31st.
Disclaimer: Past performance is not indicative of future results. Trading futures involves substantial risk of loss. Only trade with capital you can afford to lose. Backtest results include hypothetical performance that may not reflect actual trading conditions including slippage, commissions, and market impact.